FIGURE 5.
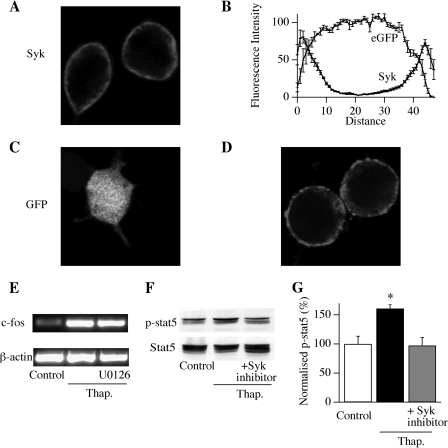
Syk recruits the transcription factor STAT5. A, distribution of endogenous Syk in resting RBL-1 cells, observed using immunocytochemistry. B, aggregate data measuring the intensity of Syk fluorescence across the lateral profile of cells is shown, measured in line scan mode (nine cells for Syk and 11 for green fluorescent protein). C, distribution of green fluorescent protein (GFP), used as a cytoplasmic marker, in an RBL-1 cell. D, Syk remains at the plasma membrane following stimulation with thapsigargin. E, thapsigargin (Thap.)-evoked c-fos expression is unaffected by blocking the MEK/ERK pathway with U0126. F, thapsigargin promotes phosphorylation of the transcription factor STAT5, and this is prevented by inhibition of Syk. G, aggregate data from three experiments (as in F) are shown. The thapsigargin-stimulated group differs significantly from control (non-stimulated) and thapsigargin/Syk inhibitor groups (*, p < 0.01, ANOVA). Thapsigargin/Syk inhibitor group was not significantly different from the control (non-stimulated) one (p > 0.5).

