FIGURE 6.
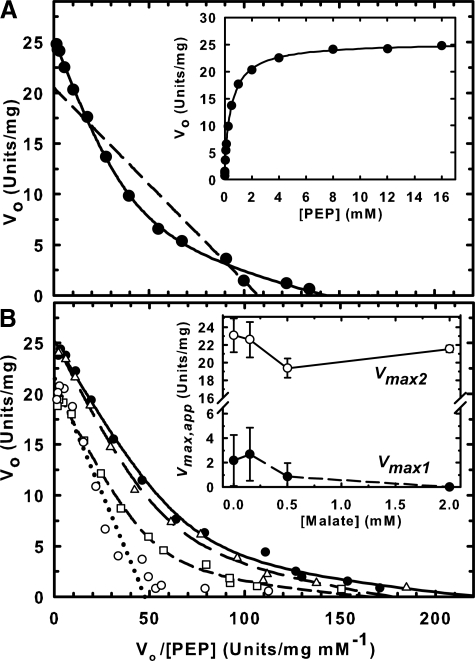
Analysis of the biphasic PEP saturation kinetics of a chimeric Class-2 PEPC. A, PEP saturation curves were determined at pH 7.3 and fitted to either a single catalytic site Michaelis-Menten model (dashed line) or a biphasic model with two distinct catalytic sites (solid line) and plotted as Eadie-Hofstee linearizations. Inset, plot of the reaction rate versus PEP concentration. B, PEP saturation curves were determined at pH 7.0 in the presence of 0 (●), 0.2 (Δ), 0.5 (□), and 2 mm (○) malate and analyzed as above. Inset, relationship between Vmax(app) values and malate concentration. Vmax1 (●) and Vmax2 (○) correspond to the Vmax(app) values obtained for the low (AtPPC3) and high (RcPPC4) Km(PEP) sites, respectively, as discussed in the text. All data represent the mean ± S.E. of four separate determinations.

