FIGURE 7.
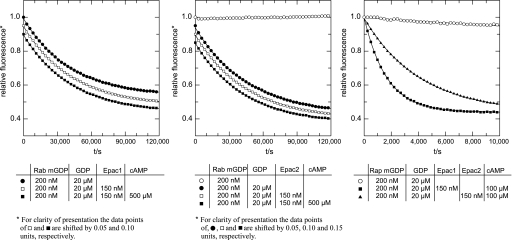
Epac is not a GEF for Rab3A. The dissociation of the Rab3A-mGDP complex was monitored by a time-dependent decrease in fluorescence intensity. Rab3A (200 nm) was loaded with the fluorescent nucleotide analogue mGDP and incubated in the presence (squares) or absence (circles) of inactive (□) or activated (500 μm cAMP treated; ■) 150 nm Epac1 (left) or Epac2 (center) after the addition (●) or not (○) of a 100-fold excess (20 μm) of unlabeled GDP, as indicated under “Experimental Procedures.” For clarity of presentation and to avoid the overlay of symbols, in the left panel the data points of □ and ■ were shifted by 0.05 and 0.1 relative units, respectively. Likewise, in the center panel data points of ●, □, and ■ were shifted by 0.05, 0.10, and 0.15 units, respectively. Please note that mGDP can be displaced very slowly from Rab3A (note the difference in time scales between the right panel and the rest) by an excess of GDP; thus the Rab protein is properly folded in a native, nucleotide-interacting state. The right panel demonstrates that the Epac1 (■) and Epac2 (▴) preparations were active and exhibited GEF activity toward Rap. Briefly, Rap1 (200 nm) was loaded with the fluorescent nucleotide analogue mGDP and incubated in the absence (○) or presence of activated (100 μm cAMP treated) 150 nm Epac1 (■) or Epac2 (▴) after the addition of a 100-fold excess (20 μm) of unlabeled GDP, as indicated under “Experimental Procedures.” The data represent the mean ± S.E. of at least two independent experiments.

