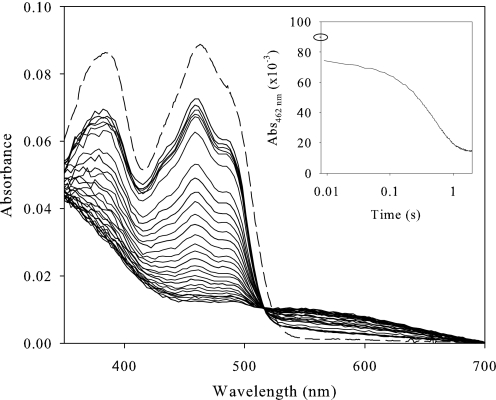
FIGURE 3.
Time-dependent spectral changes during AAO turnover with p-anisyl alcohol. An aerobic solution of AAO (9 μm) was reacted in the stopped-flow instrument with 1 mm p-anisyl alcohol. The oxidized AAO spectrum before mixing is indicated by a dashed line, the first spectrum was recorded 0.009 s after mixing, in the 0.009–0.050 s range spectra are shown each 10 ms, and thereafter each 50 ms. The inset shows the course of the reaction monitored at 462 nm (logarithmic time scale). A closed circle indicates the initial absorbance of oxidized AAO. Measurements were carried out in 100 mm phosphate, pH 6, at 20 °C.

