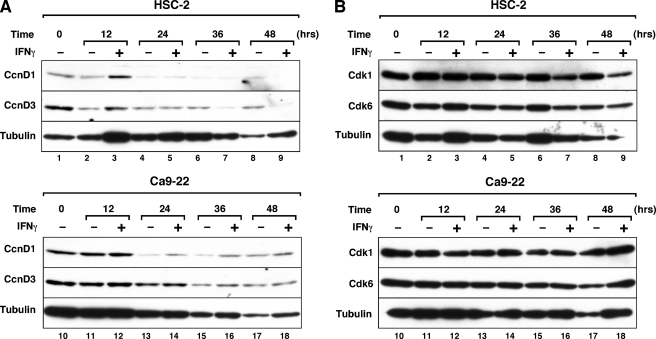
FIGURE 5.
Effect of IFNγ on cyclin D and Cdk protein expression levels in HSC-2 and Ca9–22 cells. Cells were either left untreated or were treated with IFNγ (10 ng/ml) for the indicated time periods, as described in the legend for Fig. 4. Equal amounts of cellular protein (40 μg/lane) were loaded in the gel and analyzed by Western blotting using the indicated antibodies. Similar results were obtained in three separate experiments.

