FIGURE 4.
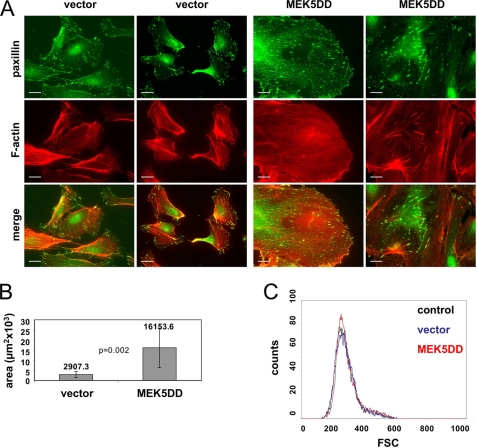
Expression of MEK5DD induces drastic morphological changes. A, cells were plated onto uncoated glass coverslips for 96 h, fixed with paraformaldehyde, and stained for paxillin (green) and F-actin (red). As the morphology of HUVEC vary significantly, two different cell images for each staining are presented. Scale bars = 20 μm. B, the mean covered area ± S.D. of 70 randomly chosen spread cells is depicted. Covered areas were measured with AxioVision software. p values were obtained by Student's t test. C, shown are the results from flow cytometric study of control, vector-transduced, and MEK5DD-transduced EC in a forward scatter light (FSC) histogram analysis. 104 cells were analyzed.

