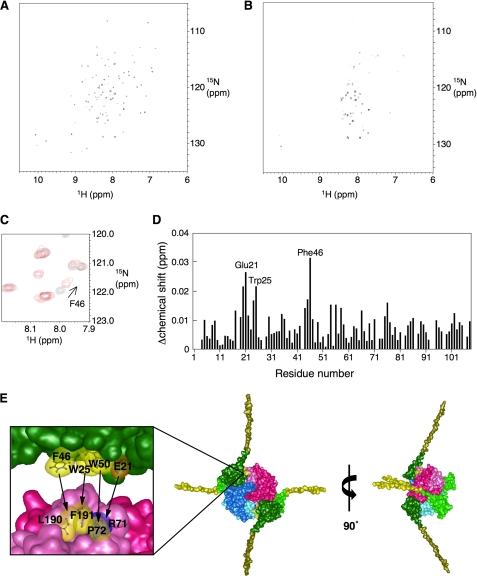
FIGURE 1.
NMR analysis and the structural model of the DiaA-DnaA N-terminal complex. A–D, NMR analysis. The 1H-15N HSQC spectrum of the DnaA N terminus was obtained in the absence (A) and presence (B) of 20 μm DiaA P72A. Part of the 1H-15N HSQC spectrum, in the absence (black) and presence (red), of 20 μm DiaA P72A shows the chemical shift change for DnaA Phe-46 (C). DiaA-dependent chemical shift changes are displayed for the backbone amides as a function of the amino acid residue number (D). All chemical shifts changes in the 1H-15N HSQC spectra were calculated according to the formula (Δδ(1H)2 + (Δδ(15N)/7)2)1/2. Glu-21, Trp-25, and Phe-46 are indicated on the graph. E, structural model for the DiaA-DnaA N-terminal complex illustrated using MolFeat (FiatLux). This model is based on the structures of a DiaA homotetramer (15) and the DnaA N terminus (23). Each protomer of the DiaA tetramer is depicted in different colors. Domain I (residues 1–86) and part of domain II (residues 87–108), within the DnaA N terminus, are colored in green and ocher, respectively. The hydrophobic residues of DiaA Pro-71, Leu-190, and Phe-191 or DnaA Trp-25, Phe-46, and Trp-50 are colored in yellow. The charged residues of DiaA Arg-71 and DnaA Glu-21 are colored in deep blue and orange, respectively. The arrows show the residues with mutual affinity between DiaA and DnaA domain I.

