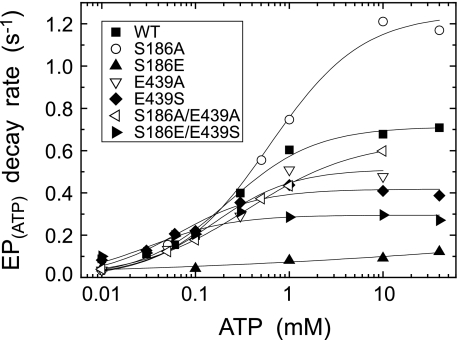
FIGURE 10.
ATP dependence of the decay rate of E1PCa2 formed from ATP. The E1PCa2 decay was followed after addition of various concentrations of ATP and 30 mm EDTA without MgCl2 (in place of 8 mm EGTA) otherwise as in Fig. 9. The single exponential decay rate of E1PCa2 obtained was plotted versus the metal-free ATP concentration, and the parameters V0, Vmax, and K0.5 estimated as in Fig. 9 are given in Table 2.

