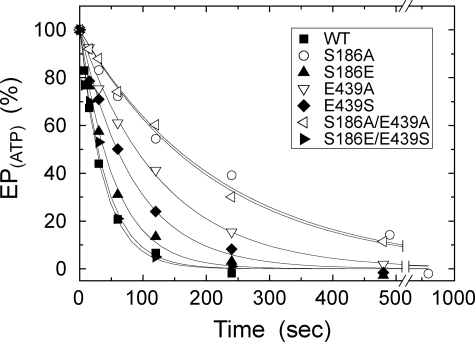
FIGURE 6.
Decay of E1PCa2 formed from ATP. Microsomes expressing the wild type or mutant were phosphorylated in 0.1 m KCl at 0 °C for 15 s as in Fig. 4A. Phosphorylation was terminated by addition of an equal volume of a buffer containing 8 mm EGTA, 0.1 m KCl, 7 mm MgCl2, and 50 mm MOPS/Tris (pH 7.0) at 0 °C. The total amount of EP remaining after the EGTA addition was determined at the indicated time. The total amounts of EP obtained at zero time (i.e. immediately before the EGTA addition) are normalized to 100%. Solid lines show the least squares fit to a single exponential, and the decay rates obtained are given in Table 1.

