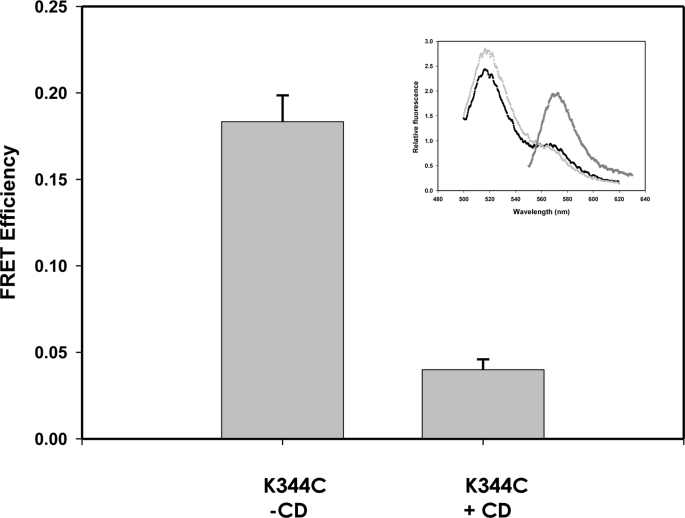
FIGURE 5.
Oligomerization of HlyA on cholesterol-depleted ghost erythrocytes. FRET measurement of HlyA K344C using control (−CD) and cholesterol-depleted (+CD) sheep ghost erythrocytes is shown. In this case, the cholesterol depletion was done with 3 mm CD treatment. Lipid concentration was 0.05 mm, and the lipid/protein ratio was 109. FRET was calculated as mentioned before under “Experimental Procedures” (n = 4). Inset, example of spectra measured for HlyA K344C bound to cholesterol-depleted ghost erythrocytes. Fluorescence emission spectrum of ghost erythrocytes containing D/A, FD/A(480, λem) (excited at 480 nm) (●), emission spectrum of ghost erythrocytes labeled only with donor, FD(480, λem) (gray circle), and spectrum of ghost erythrocytes containing D/A, FD/A(530, λem) (excited at 530 nm where only the acceptor absorbs) (inverted gray triangle).

