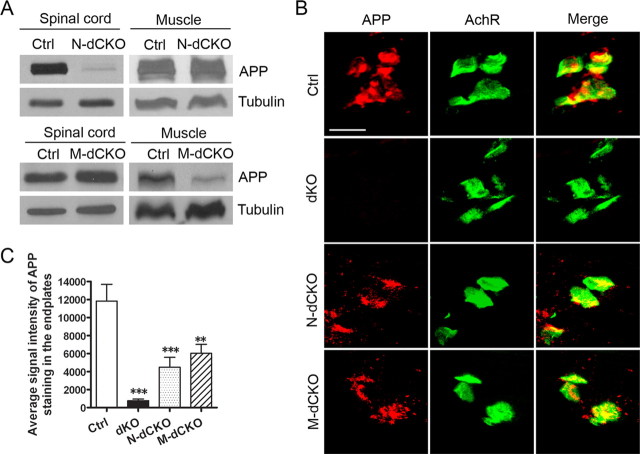
Figure 1.
Biochemical and immunohistochemical characterization of APP expression and localization. A, Western blot analysis of APP protein levels from P0 spinal cord or muscle samples of APLP2-null control (Ctrl), neuronal or muscle conditional APP knock-out on APLP2-null background (N-dCKO and M-dCKO, respectively) using the APPc antibody. Tubulin was used as a loading control. B, Immunofluorescence staining of P0 stenomastoid muscle sections of control (Ctrl), APP/APLP2 double knock-out (dKO), N-dCKO, or M-dCKO animals using the anti-APP antibody Y188. α-BTX staining was used to mark the postsynaptic AchRs. Merge, Overlay of APP and AchR images. Scale bar, 20 μm. C, Quantification of APP signal intensity (mean ± SEM) (2 animals/genotype; 6 sections/animal) in AchR-positive endplates. **p < 0.01, ***p < 0.001 compared with control (one-way ANOVA).

