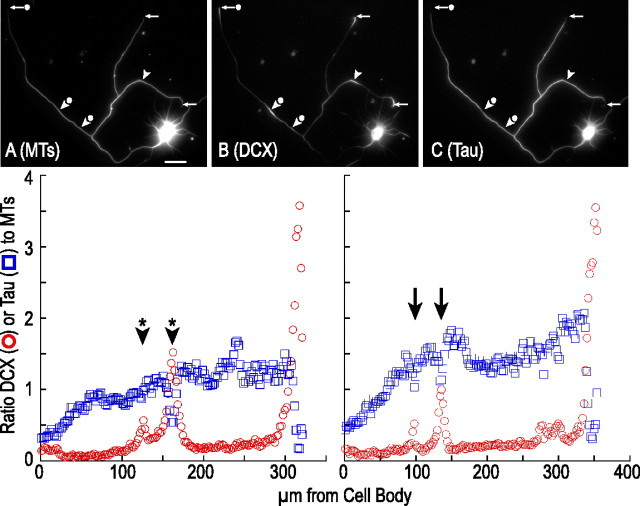
Figure 7.
Tau staining is reduced in focal accumulations of DCX that occur along the axon and in the growth cone. A–C show a hippocampal neuron triple stained to reveal microtubules (MT), DCX, and tau. The arrowheads identify sites along the axon that have focal accumulations of DCX. Note that, in these regions, tau staining is diminished relative to that on either side of the accumulations. The arrows identify growth cones, all of which stain prominently for DCX but weakly for tau. Scale bar, 29 μm. The bottom show the ratio of DCX-to-microtubules (red circles) or tau-to-microtubules (blue squares) in consecutive 2.5 μm segments in two different axons. The left shows the longest axon of the neuron depicted in A–C; the arrowheads with * identify the location of the focal accumulations of DCX. The right is derived from an axon of a different neuron that has two focal accumulations of DCX (arrows). Note that, in both axons, tau staining declines in these regions and by an amount that is related to the magnitude of the increase in DCX staining.

