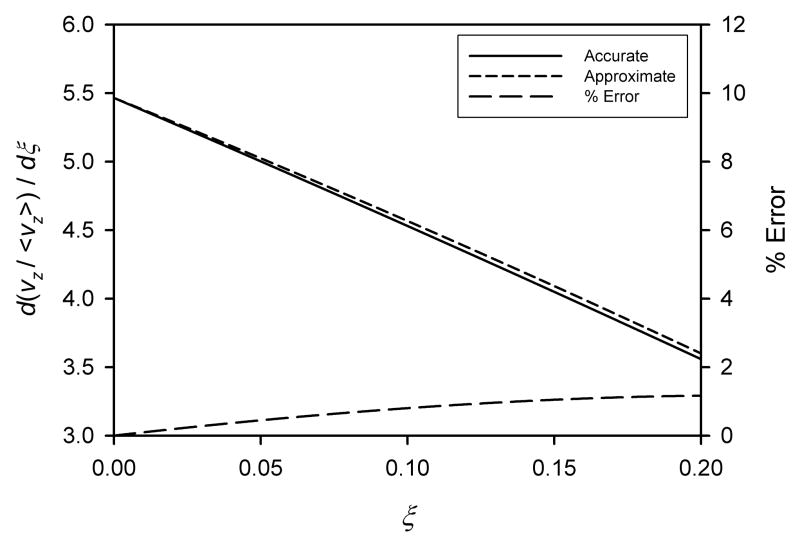
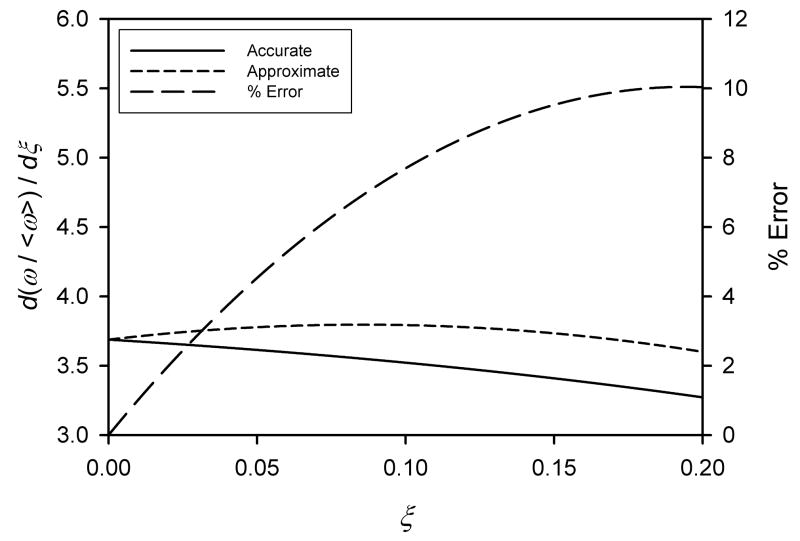
Figure 2.
The first derivative of the normalized fluid velocity profiles with respect to ξ in the region of the accumulation (outer) wall. The approximate curves are based on the respective cubic approximations to velocity profiles. The curves of % errors refer to the right-hand axes. a) Longitudinal velocity, b) Angular velocity, c) Azimuthal velocity. In all cases ρi = 0.5 in order to better illustrate the relative goodness of the fits.


