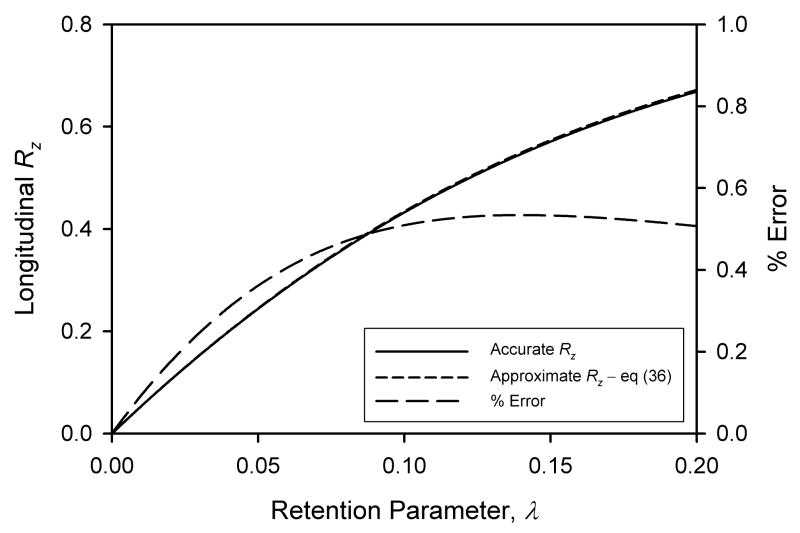
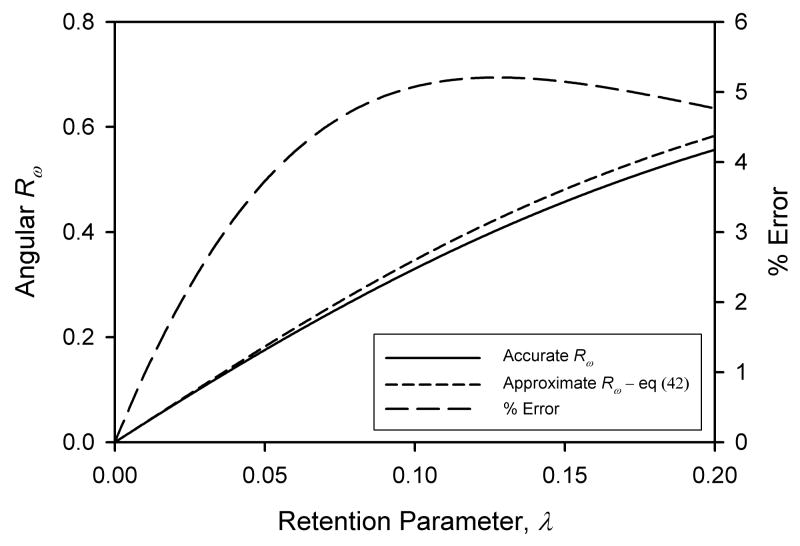
Figure 3.
Comparison of numerically determined retention ratios based on true velocity profiles with results based on cubic approximations to velocity profiles. a) Longitudinal retention ratio Rz, approximate result by eq (36); b) Angular retention ratio Rω, approximate result by eq (42); c) Angular retention ratio Rω, approximate result by eq (46). The curves of % errors refer to the right-hand axes. In all cases ρi = 0.5.


