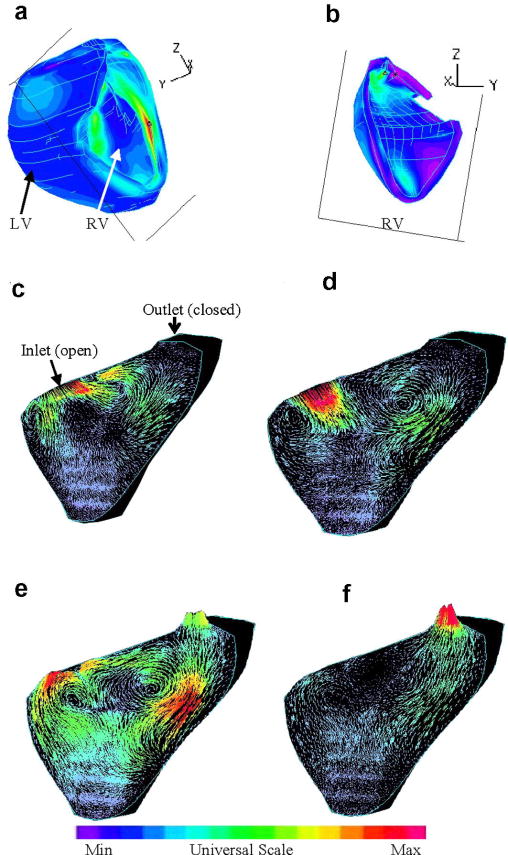
Figure 5.
Velocity plots on a cut surface at different phases showing interesting flow patterns. (a)-(b) The position of the cut-surface, left and right views; (c) beginning of the filling phase; (d) flow patterns just before the ending of filling phase; (e) beginning of the ejection phase. The inlet was just closed. The outlet valve is open; (f) ejection continues.

