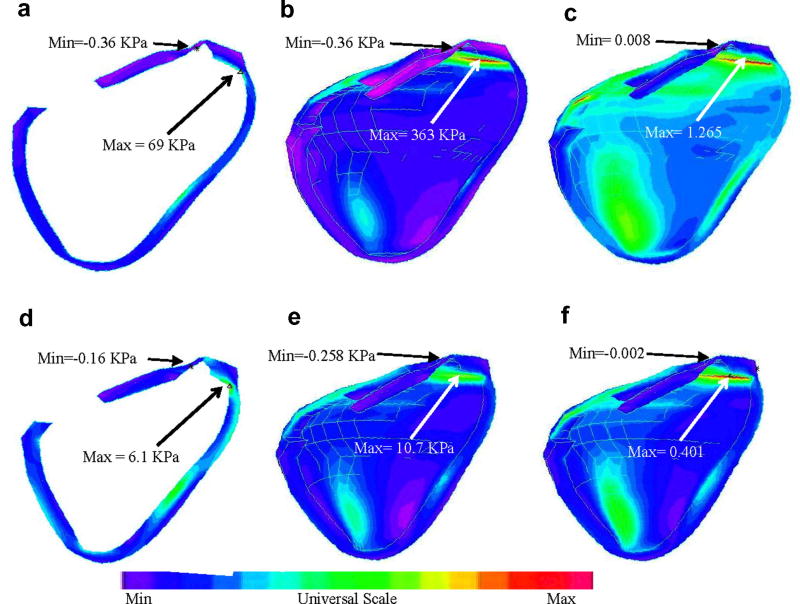
Figure 7.
Stress/strain distributions in the RV may provide useful information for mechanical analysis and disease state assessment. (a) Transverse view of Stress-P1 under maximum pressure; (b) Stress-P1 on the inner surface of RV under maximum pressure; (c) Strain-P1 on the inner surface of RV under maximum pressure; (d)-(f) Stress/Strain plots corresponding to minimum pressure condition.

