Figure 3.
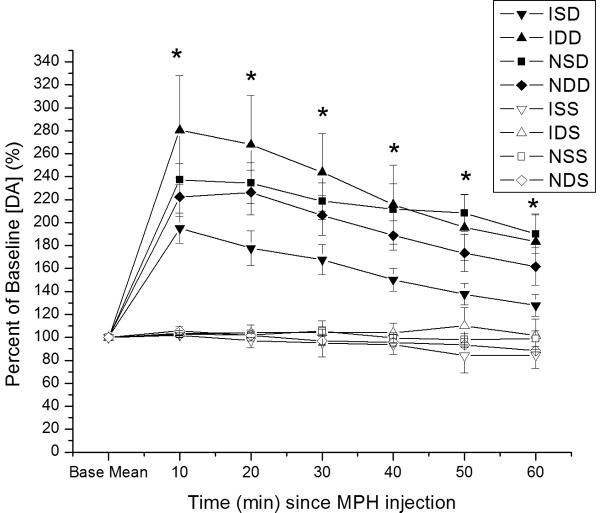
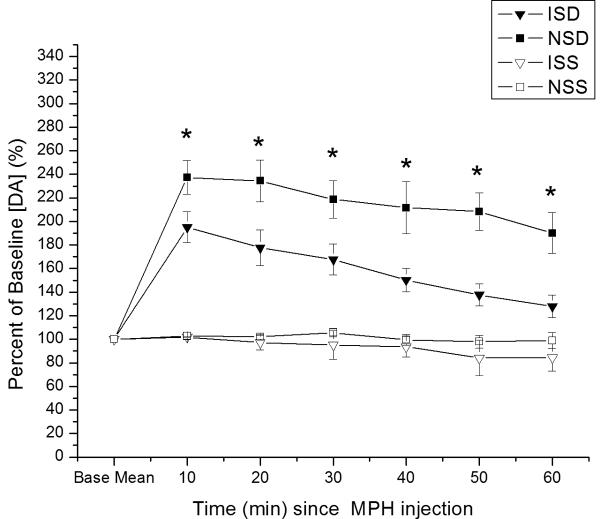
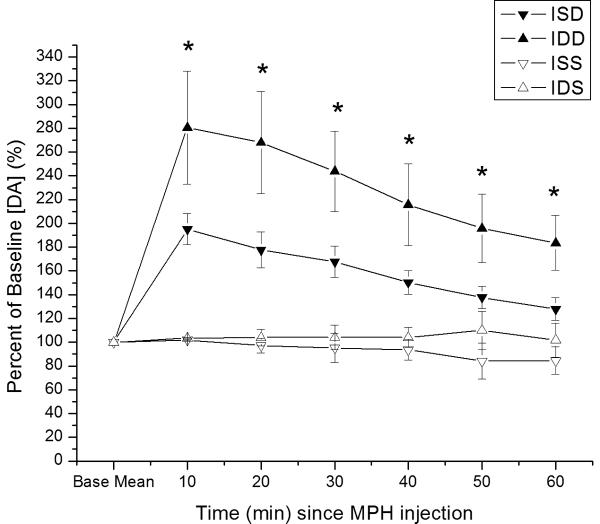
Time dependent relative changes in electrically evoked overflow DA with 5 mg/kg MPH vs. saline injection challenge. Experimental groups pretreated with either saline or MPH 5mg/kg. Values reported at each time point as percent of baseline values ± SEM. A). All eight experimental groups plotted as percent change in evoked DA overflow vs. time post MPH injection. Group differences in evoked overflow at each time point post-injection (*p<0.0001 all comparisons for overall group effect with ANOVA at each time point). B) Percent change in evoked DA overflow over time for injury and naïve groups pretreated with saline. Group differences in evoked overflow at each time points post-injection (*p<0.0001 all comparisons for overall group effect with ANOVA at each time point) C) Percent change in evoked overflow over time for injury groups. Group differences between groups at all time points post-injection (*p<0.04 all comparisons for overall group effect with ANOVA at each time point) (ISD=CCI with saline pretreatment and MPH challenge; IDD=CCI with MPH pretreatment and MPH challenge; NSD=Naïve with saline pretreatment and MPH challenge; NDD=Naïve with MPH pretreatment and MPH challenge; ISS=CCI with saline pretreatment and saline challenge; IDS=CCI with MPH pretreatment and saline challenge; NSS=Naïve with saline pretreatment and saline challenge; NDS=Naive with MPH pretreatment and saline challenge.)


