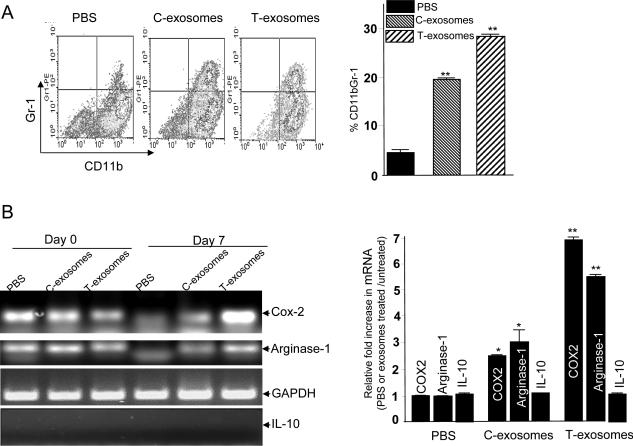
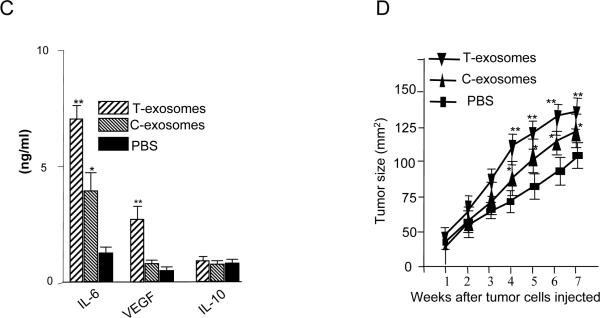
Figure 2. The tumor microenvironment has a significant effect on T-exosome mediated induction of proinflammation cytokines, tumor growth factors of MDSCs and tumor progression.
Bone marrow cells were cultured in RPMI 1640 supplemented with 10% FBS and 20 ng/ml recombinant mouse GM-CSF. C- and T- exosomes (1 μg/ml) were added to the cultured cells after the addition of the GM-CSF to the cultures. After 7 days in culture, the cells were analyzed for the expression of CD11b+Gr-1+ cells using FACS. One representative of three independent experiments is shown (A, left panel). All FACS analysis results are presented as the mean ± SEM obtained for three samples in three independent experiments (A, right panel). A portion of 7-day cultured cells treated as described above was sorted for CD11b+Gr-1+ by FACS and used for RT-PCR analysis of mouse Cox2, arginase-1, and IL-10 expression. GAPDH mRNA levels are included as a loading control. The results are representative of three independent experiments of RT-PCR results (B, left panel). The same RNA used for RT-PCR was also used for real-time PCR to quantitate Cox2, Arginase-1, and IL-10 (B, roght panel) using the protocol as described in the Materials and Methods. Data were first normalized from nontreated cells and then presented as ratios of PBS, C-, and T- exosome-treated/untreated CD11b+Gr-1+ cells (n = 5) in triplicate, mean ± SEM; *, p < 0.005; **, p < 0.01.
The supernatants of 7-day cultures were collected and induction of IL-6, VEGF, and IL-10 was determined using an ELISA as described in the Material and Methods section. The results represent the mean ± SEM of triplicate cultures (C). After 7-days in culture, the FACS sorted CD11b+Gr-1+ cells were mixed with TS/A tumor cells at the ratio of 1:3 and the cell suspension was injected into the mammary fat pad of 7-week-old female BALB/c mice. The size of the implanted tumors was measured weekly. Each point represents the mean size ±SEM of the 5 mice from each group (D), *, p < 0.05; **, p < 0.01.


