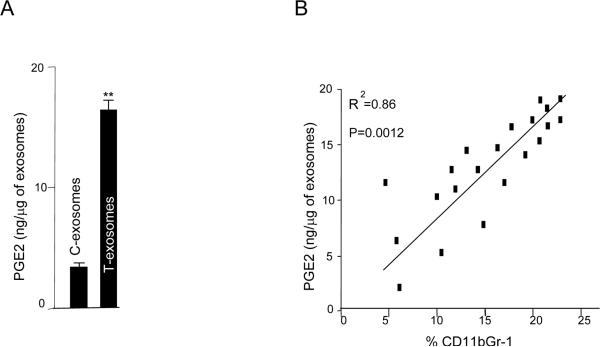
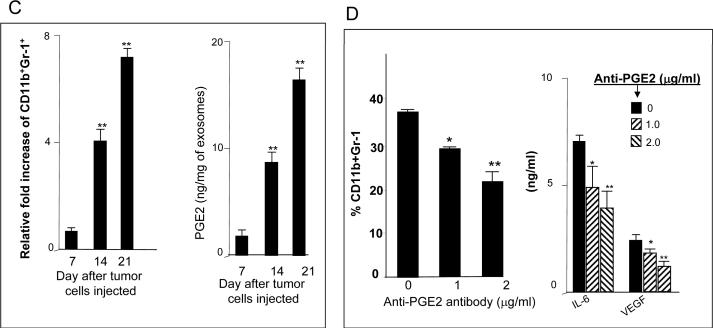
Figure 3. The tumor microenvironment regulates the enrichment of tumor exosomal PGE2 which in turn promotes the induction of CD11b+Gr-1+ cells.
One μg of C-exosomes and T-exosomes was diluted in 50 μl of RPMI1640 and used to quantify PGE2 amounts using an ELISA. All data represent the mean ± SEM obtained for four samples in three independent experiments (A). The mean PGE2 levels of T-exosomes prepared from TS/A tumor removed from BALB/c mice at day 7, 14 and 21 post injection were calculated based on PGE2 ELISA data. PGE2 ELISA data represent the mean ± SEM obtained for four samples in three independent experiments and were plotted against the mean percents of CD11b+Gr-1+ cells isolated from corresponding tumor samples (%CD11b+Gr-1+/10,000 leukocytes cells isolated from tumor tissue). Each point represents the mean value of each tumor. The correlation between the two variables was calculated using a linear regression analysis_(B). Total bone marrow cells were isolated from the BM of 2-mo-old female BALB/c mice and stimulated with GM-CSF in the presence of TS/A T-exosomes isolated from tumor removed at different days after injecting tumor cells or BSA as a control (1 μg/ml for 7 days). The expression of CD11b+Gr-1+ markers on cell surfaces was determined using FACS. Data are presented as the n-fold increase of CD11b+Gr-1+ cells caused by addition of T-exosomes compared with BSA treatment (C, left panel). T-exosomes were prepared from TS/A tumor removed from BALB/c mice at day 7, 14 and 21 post injection of tumor cells. One μg of supernatant from the T-exosomes was diluted in 50 μl of RPMI 1640 and used to quantify PGE2 amounts using an ELISA. All data represent the mean ± SEM obtained for four samples in three independent experiments (C, right panel). Bone marrow derived cells were cultured as described in Figure 3C with the addition of T-exosomes-d21 preincubated with anti-PGE2 antibody. At day 7 in culture, the percent of double positive myeloid cells for Gr-1 and CD11b were determined using FACS (D, left panel). The supernatants of the 7-day cultures were collected and the amounts of IL-6, and VEGF (D, right panel) were determined using an ELISA. Data are given as the mean ± SEM obtained for five samples in two independent experiments, *, p < 0.05; **, p < 0.01.


