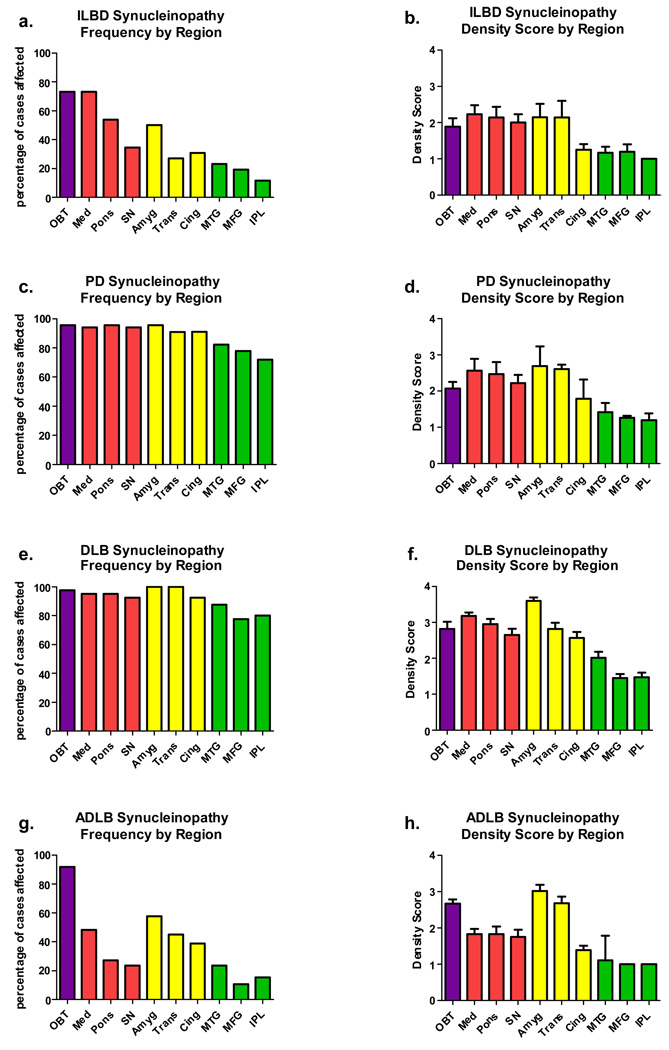
Figure 2.
Graphic depiction of Lewy-type synucleinopathy frequency (a,c,e,g) and density (b,d,f,h) by brain region. Purple bars are for olfactory bulb, red are for brainstem regions, yellow are for limbic regions and green are for neocortical regions. Error bars are standard error of the mean. Mean density scores differed significantly between regions for all diagnostic groups shown (p < 0.001). Abbreviations: OBT = olfactory bulb and tract; Med = medulla; SN = substantia nigra; Amyg = amygdala; Trans = transentorhinal cortex; Cing = cingulate gyrus; MTG = middle temporal gyrus; MFG = middle frontal gyrus; IPL = inferior parietal lobule.

