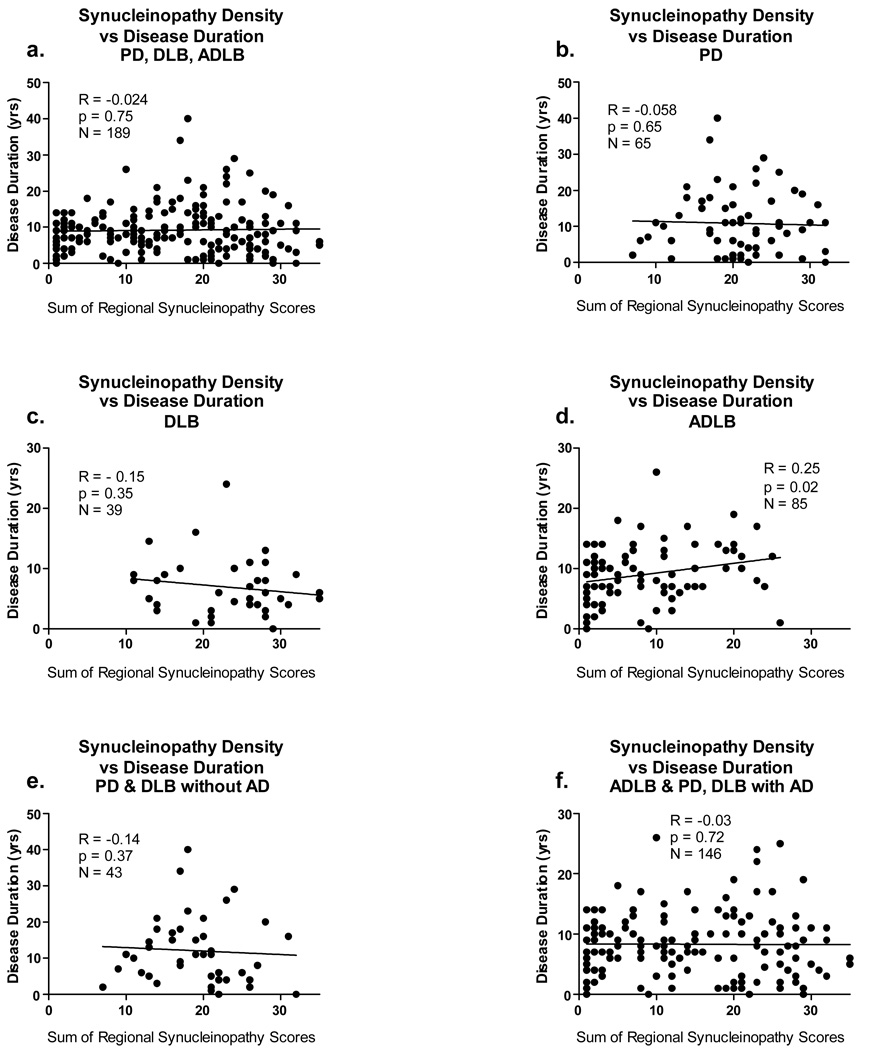
Figure 8.
Graphs depicting correlations between the sum of brain regional synucleinopathy density scores and disease duration, in subjects divided or not divided by diagnostic group and presence or absence of AD. The graph titled “with AD” included data from all subjects who also met NIA-Reagan “intermediate” or “high” criteria for AD, regardless of their other diagnoses. The graph titled “without AD” included data from all subjects who did not meet NIA-Reagan “intermediate” or “high” criteria for AD, regardless of their other diagnoses. R = Spearman Rho; N = number of subjects included in the analysis; p = probability. Abbreviations otherwise as for Figure 2.

