
Figure 3. Serial MR images and corresponding histology along an AV graft taken at 6 weeks after graft placement.
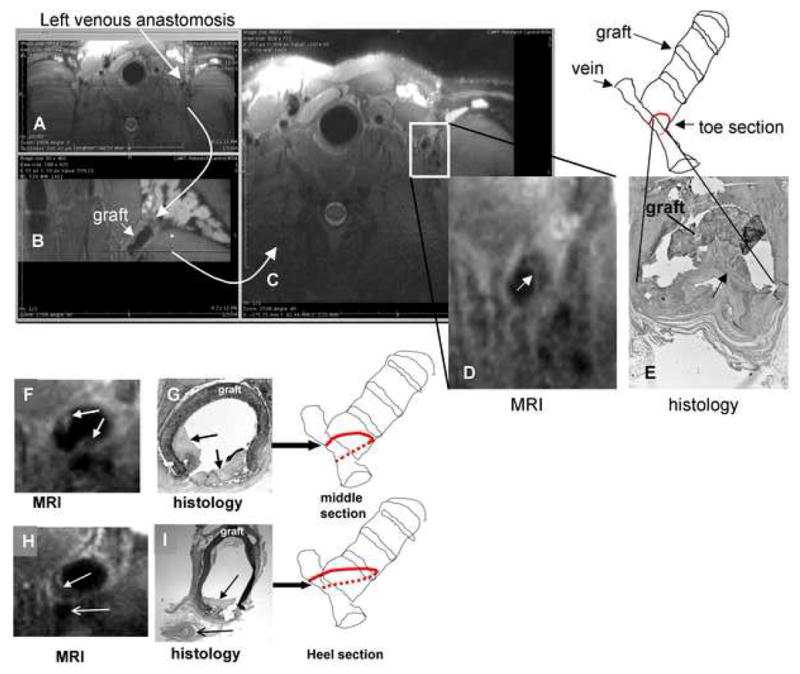
The axial MR image (a 3D volume collected by 3D TSE) of the left venous anastomosis in a pig (A) underwent 2D multi-planar reconstruction to yield (B) and (C). (B) provides a view orthogonal to the vertical dotted line dissecting the anastomosis in (A). (C) provides a view orthogonal to the horizontal dotted line dissecting (B). The view in (B) provides orientation of the angle and location at which the image in (C) was collected, allowing accurate registration of the MR image with the histological image in (E). (D) shows the enlarged image of the venous anastomosis collected in (C) with the closed arrow pointing to the hyperplastic tissue lining the graft. The line drawing represents the graft image in (B) and the location from which the MR image in (D) and histological section in (E) were obtained. (F) and (H) show respective MR images obtained from the sequential middle and heel sections of the same venous anastomosis presented in (A), while (G) and (I) are the corresponding histological sections (stained with H&E). The open arrows in (H) and (I) indicate an adjacent blood vessel. Closed arrows in this figure indicate hyperplastic tissue.