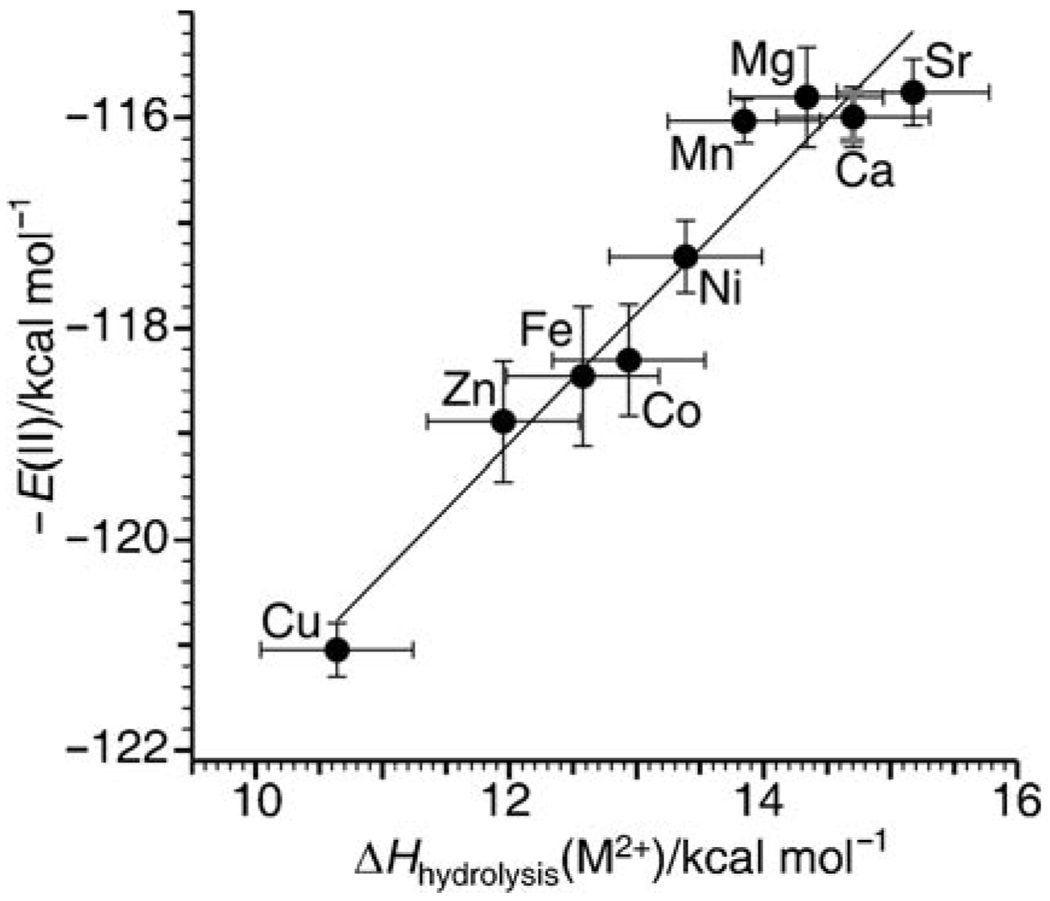
Figure 4.
The negative of E(II), from gas-phase nanocalorimetry measurements, versus enthalpy of solution-phase hydrolysis. The black vertical error bars reflect the uncertainty in the average number of water molecules lost propagated from the signal-to-noise level in the electron capture dissociation mass spectra for each metal ion. The vertical grey error bars for Ca represent the standard deviation in the number of water molecules lost from three replicate measurements made over 18 months. The horizontal error bars correspond to one standard deviation in the entropy correction.[59]

