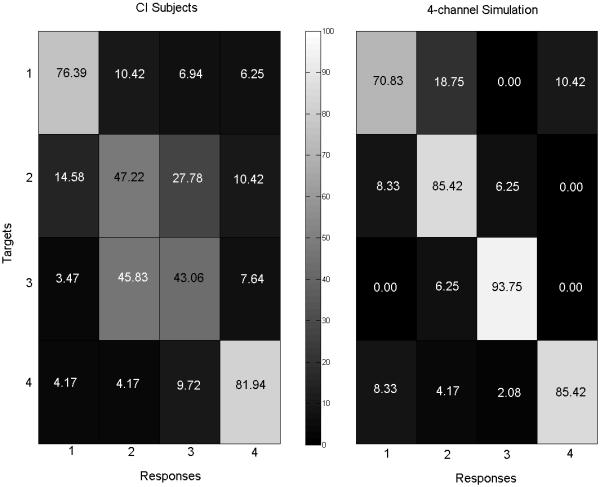
Figure 4.

Tone confusion matrices for single-syllable tones for CI subjects (left panel) and NH subjects listening to a 4-channel noise-band CI simulation (right panel; data from Luo and Fu, 2009). The percentages of tone responses to target tones are shown in each cell using numbers and shaded according to a grayscale continuum (shown between the panels).
