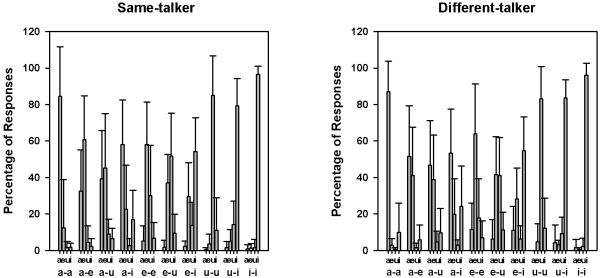
Figure 7.
Distribution of CI subjects’ vowel responses (in percentage of responses) for different vowel pairs in the concurrent syllables. The left and right panels show the results for the same- and different-talker conditions, respectively. The error bars represent one standard deviation of the mean.

