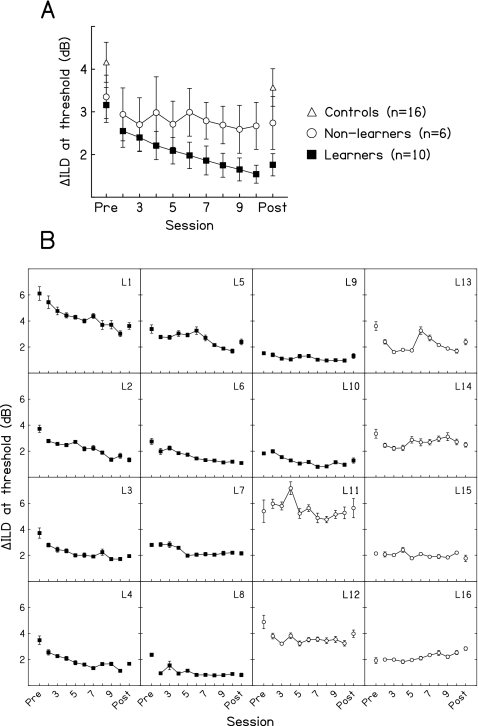
Figure 1.
Performance on the trained condition. (A) The mean ILD-discrimination thresholds for the 10 learners (filled squares), 6 non-learners (open circles), and 16 controls (open triangles) from the pretest, training sessions, and post-test. (B) Individual data for the ten learners (filled squares) and six non-learners (open circles). Error bars represent ±1 standard error (A) across or (B) within listeners.

