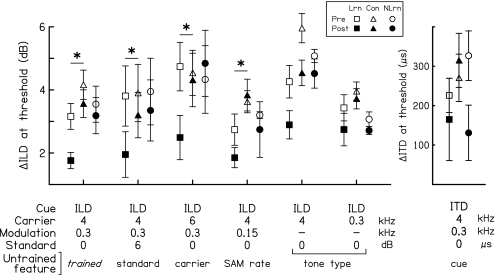
Figure 2.
Pre- and post-test performance on the trained and untrained conditions. The mean discrimination thresholds of the learners (squares), the non-learners (circles), and the controls (triangles) for both the pretest (open symbols) and post-test (filled symbols) in the six ILD conditions (left panel) and one ITD condition (right panel). The error bars represent ±1 standard error across listeners. Conditions are denoted on the abscissa by the interaural cue manipulated, the carrier frequency, the modulation rate, and the standard cue value. The trained condition is at the far left. For each untrained condition, the untrained feature is marked. Asterisks indicate that there was a significant difference in the amount of improvement from the pretest to the post-test between the learners and controls [p<0.05 for the group by time interaction in a two group (learners vs controls) by two time (pretest vs posttest) ANOVA].

