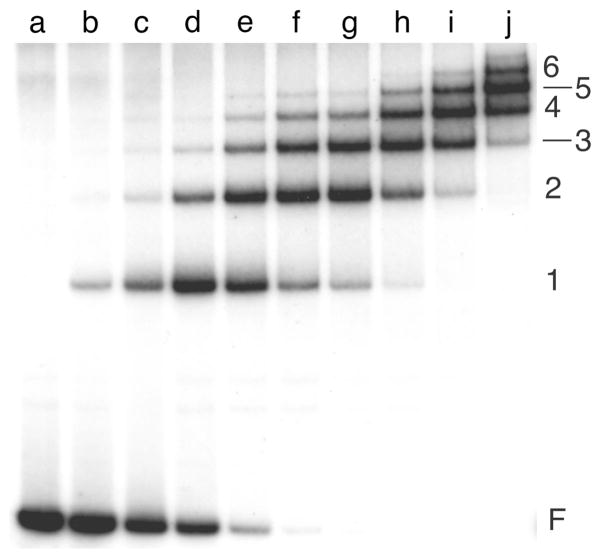
Figure 3. Titration of a 203 bp lac promoter DNA with E. coli lactose repressor.
All samples contained 1.91 × 10⁻⁹ M DNA; samples b-j contained 0.08, 0.16, 0.32, 0.48, 0.61, 0.83, 0.99, 1.32, 1.66 × 10⁻⁸ M repressor protein, respectively. The binding buffer contained 10 mM Tris (pH 8 at 20°C), 1 mM EDTA, 50 mM KCl, 100 μg/mL bovine serum albumin, 5% v/v glycerol. Samples were resolved on a 5% w/v polyacrylamide gel cast and run at room temperature (20 ± 2°C) in 45 mM Tris-borate (pH 7.8), 2.5 mM EDTA. Electrophoretic species are designated F, free DNA or numbered (1–6) to indicate the repressor:DNA ratio of the corresponding complex7. Under these conditions, repressor binds non-specific sites as well as its specific operator sequences.

