
Figure 2.
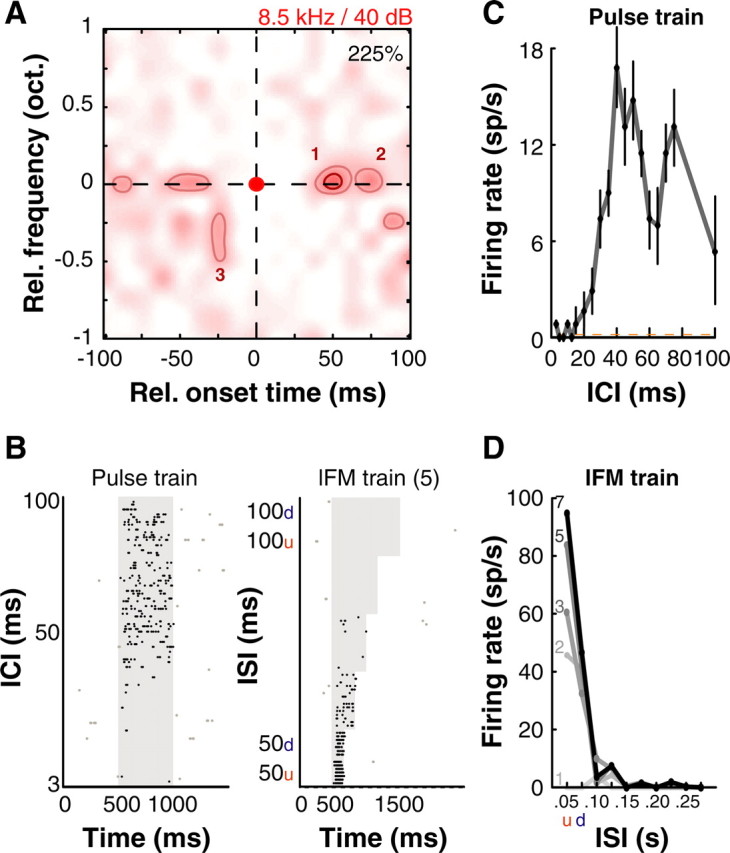
Example A1 neuron that displayed selectivity to repetitive stimuli. A, Subunits were observed at 8.5 kHz (BF) spaced at ∼50 ms intervals. Another significant subunit was located 0.25 octaves below BF occurring ∼25 ms earlier. B, Spike rasters of this neuron's response to Gaussian pulse trains (left) and lFM sweep trains (right) (5 sweeps per train). Responses were sustained throughout stimulus duration. C, Consistent with the nonlinear response map, this unit was tuned to interclick intervals of 40 and 80 ms when tested with Gaussian pulse train stimuli at BF (carrier frequency 8.5 kHz, click width SD 4 ms; mean ± 1 SD plotted). ICI, Interclick interval. D, The unit preferred 50-ms-long upward lFM sweeps trains ∼8.5 kHz with a preferred intersweep interval of 50 ms, also consistent with A. At least two sweeps were required to elicit a response. Darkest line corresponds to 7 sweeps in train, lightest line to a single sweep. ISI, Intersweep interval. Colormap, contours and raster conventions as in Figure 1. “u” and “d” refer to upward and downward lFM sweeps and are alternated along the axis.