
Figure 3.
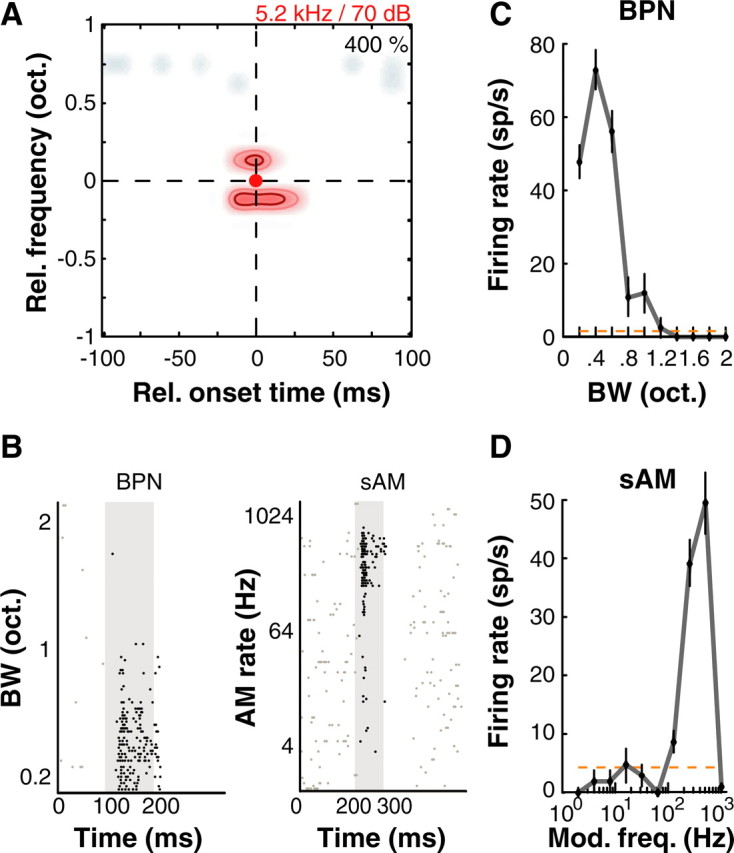
Example A1 neuron showing purely spectral combination sensitivity. A, Nonlinear interaction map for this neuron showed excitatory subunits located 1/8 oct. above and below BF at coincident onset times with the BF pip. B, Spike rasters of this neuron's response to BPN of different BWs (left) and sAM at different modulation rates (AM rate; right). C, This unit was tuned to a bandwidth of ∼0.4 oct. centered at BF and BL, consistent with the nonlinear map obtained. D, Interestingly, this unit was narrowly tuned to sAM tones at 5.2 kHz modulated at 512 Hz. It should be noted that at a BF of 5.2 kHz, this amplitude modulation at 512 Hz produces spectral sidebands that are ∼1/8 oct. away from BF. Thus, these responses are also consistent with the nonlinear map in A. Error bars correspond to ± 1 SEM; dashed orange line is spontaneous rate. Colormap, Contours and raster conventions as in Figure 1.