
Figure 4.
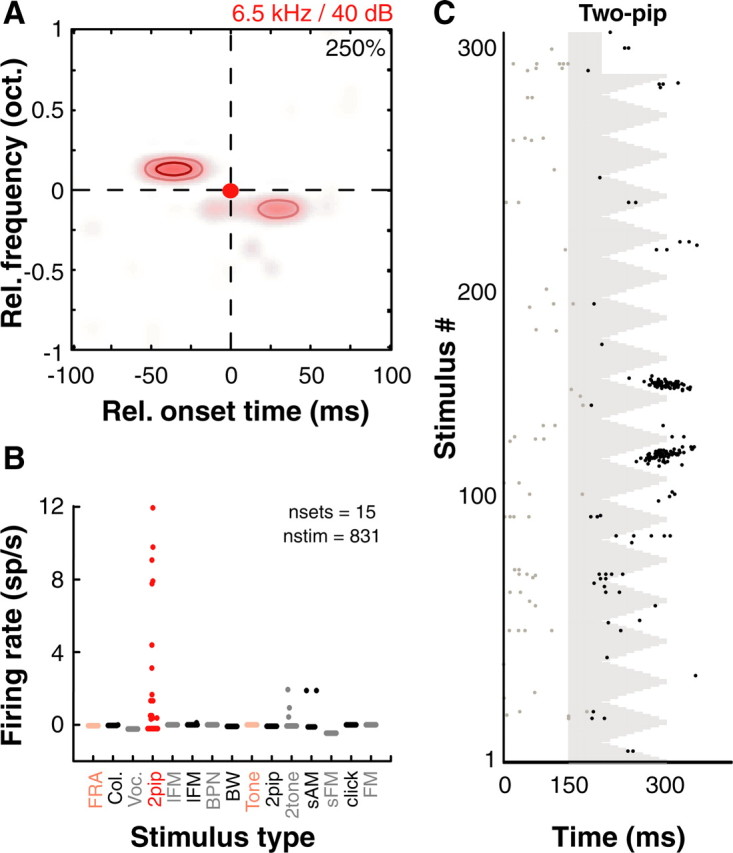
Nonlinear spectrotemporal interactions underlie complex feature selectivity in A1. A, Nonlinear interaction map of another example A1 neuron that showed strong nonlinear interactions around a BF of 6.5 kHz. B, However, this unit did not respond to a wide variety of commonly used stimuli. Red circles are responses to two-pip stimuli and pink circles are responses to pure tones. Each dot is driven response rate (after subtracting spontaneous rate) to an individual stimulus belonging to that particular stimulus set. Abbreviations used in addition to those defined in text are as follows: FRA, frequency response area (tones); Col., colony noise (environmental sounds from monkey colony); Voc., marmoset vocalizations, BW − BPN of varying bandwidths. C, Raster of two-pip responses corresponding to map in A showing robust spiking occurred after integration of both pips. Colormap, Contours and raster conventions as in Figure 1.