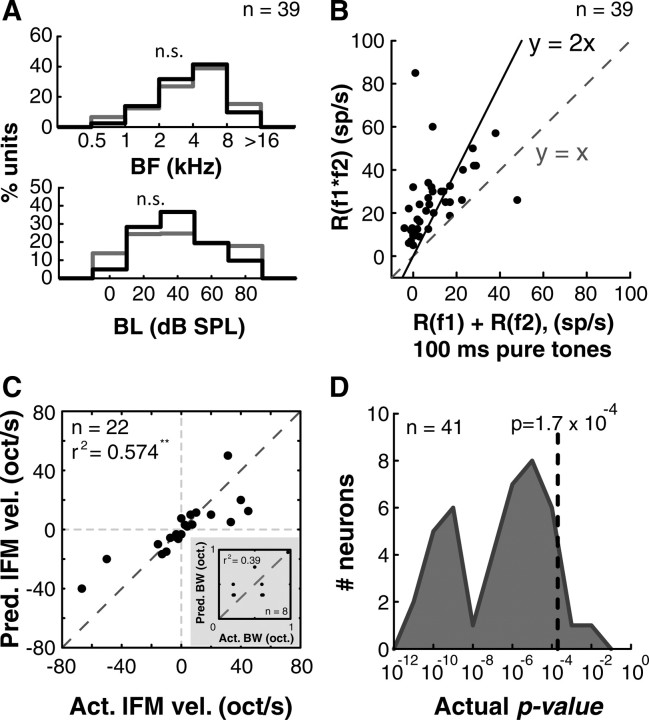
Figure 7.
Generality and robustness of A1 nonlinear neurons. A, We did not find any differences in the distributions of BFs (top) or BLs (bottom) between nonlinear neurons (black histograms) and tone-responsive neurons (gray histograms) suggesting that the observed phenomenon was a general computation (n.s., not significant). B, High nonlinearity observed was not a consequence of using short stimuli to obtain linear response rates. When responses to 100-ms-long pure tones were used to compute single-tone response rates, we still observed significant nonlinear facilitation when compared with two-pip responses computed using 20–40 ms pips. The neuron falling below the diagonal (y = x line) presumably exhibited a stimulus length effect. C, Predicted versus actual preferred lFM velocities of a subset of nonlinear units (n = 22; **p < 0.01). Inset, Predicted versus actual preferred BWs of BPN stimuli in another subset of nonlinear units (n = 8; not significant). D, Distribution of actual p values from all neurons that met our initial screening criterion of peak p < 0.05, modified permutation test (n = 41, gray histogram). Dotted line indicates the Bonferroni-corrected p value criterion for the most common stimulus set (n = 289 stimuli). Thirty-nine of 41 neurons met this criterion.

