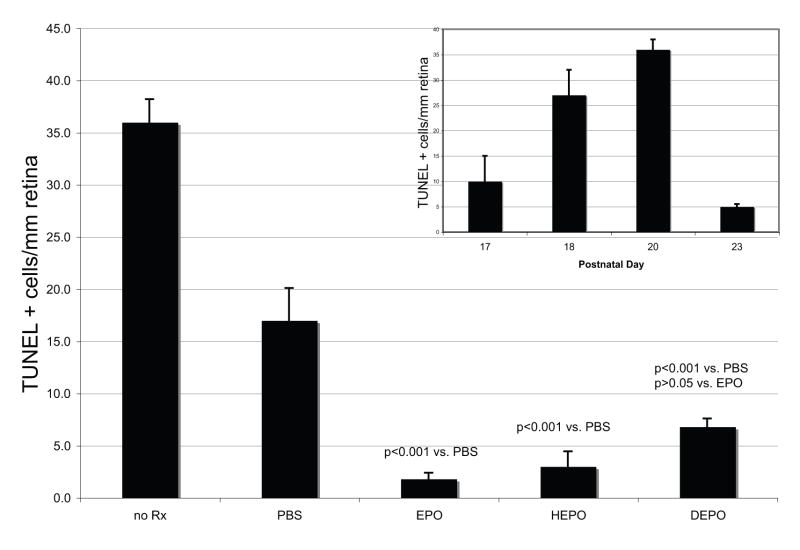
Figure 5.
Quantification of TUNEL-positive photoreceptor cells in untreated and treated rds eyes. The error bars represent the S.E.M.; p values compare treatment groups to the PBS-control group or to the EPO-treatment group, as indicated. There was no statistically significant difference between the treatment groups. Each of DEPO, EPO, and HEPO were more protective to the photoreceptors than PBS injection alone. Inset: Confirmation of the peak of TUNEL-positive cells in the rds mouse. Bar graph of TUNEL-positive cells per mm retina in PD 17, 18, 20, and 23 rds retinas. Error bars represent S.E.M.

