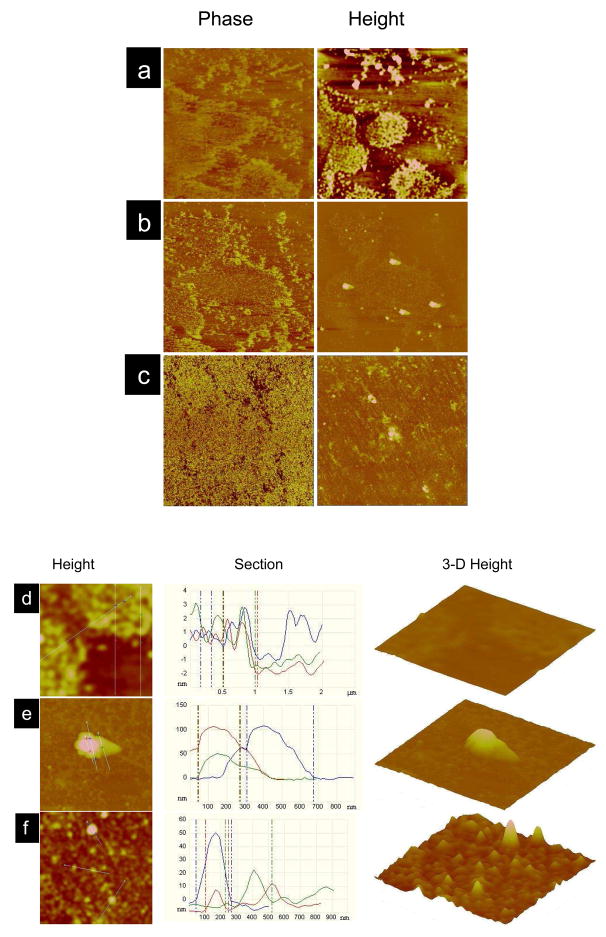
Figure 3.
Surface morphology of the endothelial cell model membrane (EMM) following interaction with NPs. Langmuir–Schaeffer films were transferred onto a silicon substrate following interaction with NPs for 20 min, and the imaging was carried out using AFM in tapping mode in air. (a) EMM alone, (b) EMM following interaction with RNPs, and (c) EMM following interaction with TAT200-RNPs. The EMM was transferred at the SP 29 mN/m for (a), whereas (b) and (c) were transferred at the SP 31, 36 mN/m, respectively. The corresponding zoom images for (a), (b), (c) are (d), (e), (f). The phase angle scale was 50° for all images. The height scales for the images were- a, = 3 nm; b, c, = 150 nm. The section analysis was carried out on the AFM height images across the white lines. The scan size for (a–c) = 10 μm and (d–f) = 2 μm.

