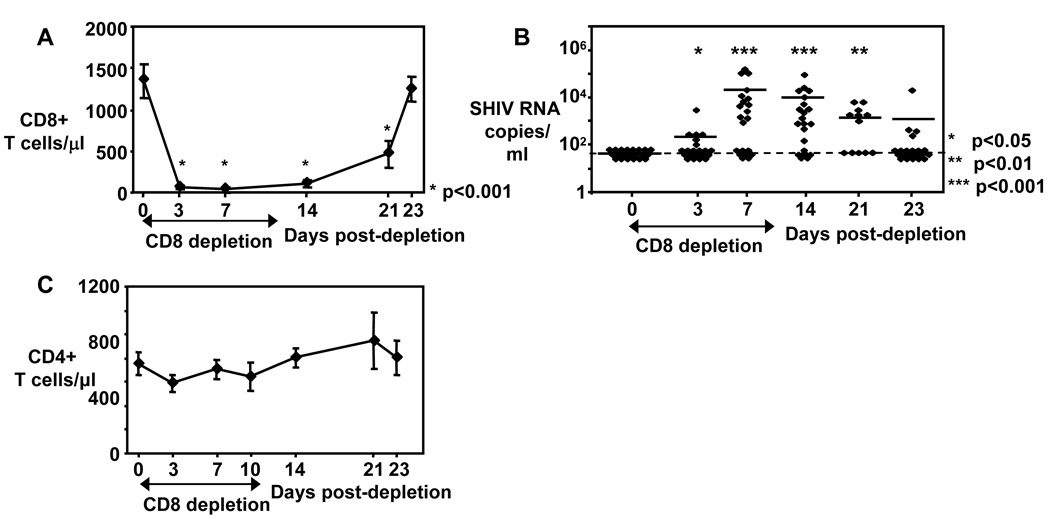
Figure 1. CD4+ T cell numbers are stable during CD8+ cell depletion.
A) Absolute CD8+ T cell numbers shown before, during and after CD8+ cell depletion. Mean ± SE depicted for n = 13 – 21. B) Viral loads (Plasma SHIV RNA copies/ml) shown before, during and after CD8+ cell depletion. Each diamond represents one animal. Line depicts mean. Dashed line indicates limit of SHIV RNA detection. A–B: Asterisks depict statistical significant changes of CD8+ T cell numbers (A) and viral loads (B) compared to day 0. C) Absolute CD4+ T cell numbers shown before, during and after CD8+ cell depletion. Mean ± SE depicted for n = 13 – 21. The nonparametric Wilcoxon Signed-Rank test for paired samples was used for statistical analysis.

