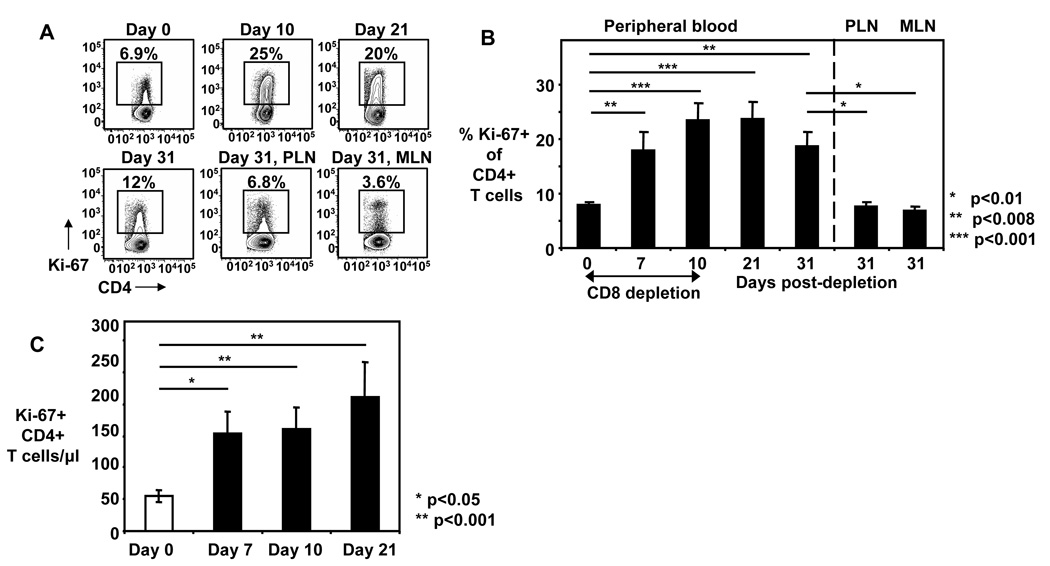
Figure 2. Ki-67+ CD4+ T cells are increased during CD8+ cell depletion.
A) Representative FACS plots shown for expression of Ki-67 on peripheral blood CD4+ T cells on day 0 up to day 31 and PLN and MLN CD4+ T cells on day 31 from one animal; numbers indicate the percentage of Ki-67+ cells of CD4+ T cells. B) Frequency of Ki-67+ cells of CD4+ T cells were measured before (day 0), during (days 7, 10) and after (days 21, 31) CD8+ cell depletion in peripheral blood and PLN and MLN (day 31). Bars show mean ± SE of peripheral blood (n=9–21), PLN (n=9) and MLN (n=8). C) Absolute Ki-67+ CD4+ T cell numbers show for days 0, 7, 10, and 21. Bars show mean ± SE. Lines and asterisks depict statistical comparison. The nonparametric Wilcoxon Signed-Rank test for paired samples was used for statistical analysis.

