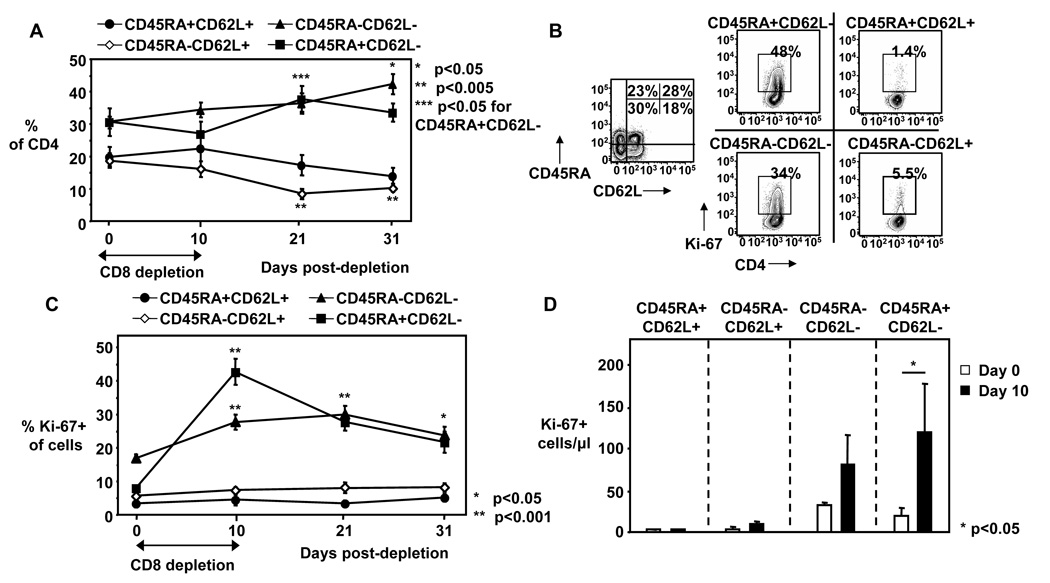
Figure 4. Effector memory CD4+ T cells are proliferating during CD8+ cell depletion.
A) Frequency of naïve (CD45RA+CD62L+), central memory (CD45RA-CD62L+), and effector memory (CD45RA-CD62L- and CD45RA+CD62L-) CD4+ T cells shown from day 0 to day 31. Mean ± SE shown for n = 13 – 21. B) Representative FACS plots from CD4+ T cells day 10 shown, left plot depicts expression of CD45RA and CD62L on CD4+ T cells, right plots depicts expression of Ki-67 on CD4+ T cell subpopulations. C) Frequency of Ki-67+ cells of CD4+ T cell subpopulations were measured in peripheral blood before (day 0), during (day 10) and after (days 21, 31) CD8+ cell depletion in macaques. D) Absolute Ki-67+ memory CD4+ T cell subpopulation numbers shown for day 0 and day 10. A–D: Mean ± SE show for n = 9–21. Asterisks depict statistical significant changes compared to day 0 (A, C) or indicate statistical comparison (D). The nonparametric Wilcoxon Signed-Rank test for paired samples was used for statistical analysis.

