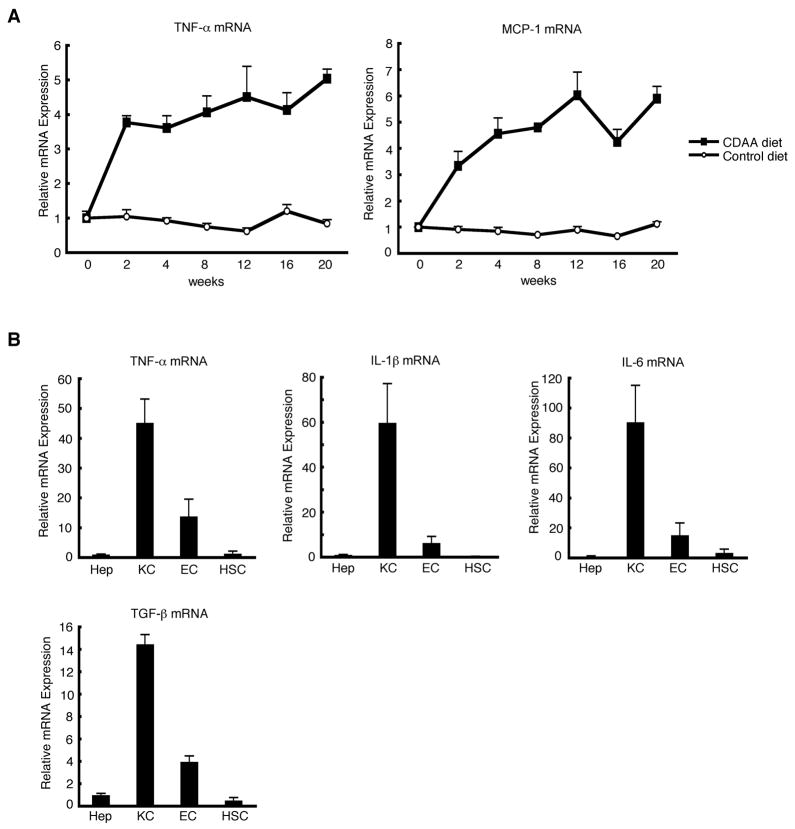
Figure 4. CDAA diet-induced hepatic inflammation is mediated by Kupffer cells.
(A) TNF-α and MCP-1 mRNA expression in the liver of mice fed CDAA diet or control diet were analyzed by quantitative real-time PCR at indicated time points (n = 3/time point). Values are mean±standard error. (B) Livers from mice fed CDAA diet for four weeks were fractionated into four major cell populations as described in Materials and Methods section. Expression of TNF-α, IL-1β, IL-6, and TGF-β mRNA was measured by quantitative real-time PCR. Results are expressed relative to the expression in hepatocyte fraction. Values are mean±standard error. Hep, hepatocytes; KC, Kupffer cells; EC, endothelial cells; HSC, hepatic stellate cells.

