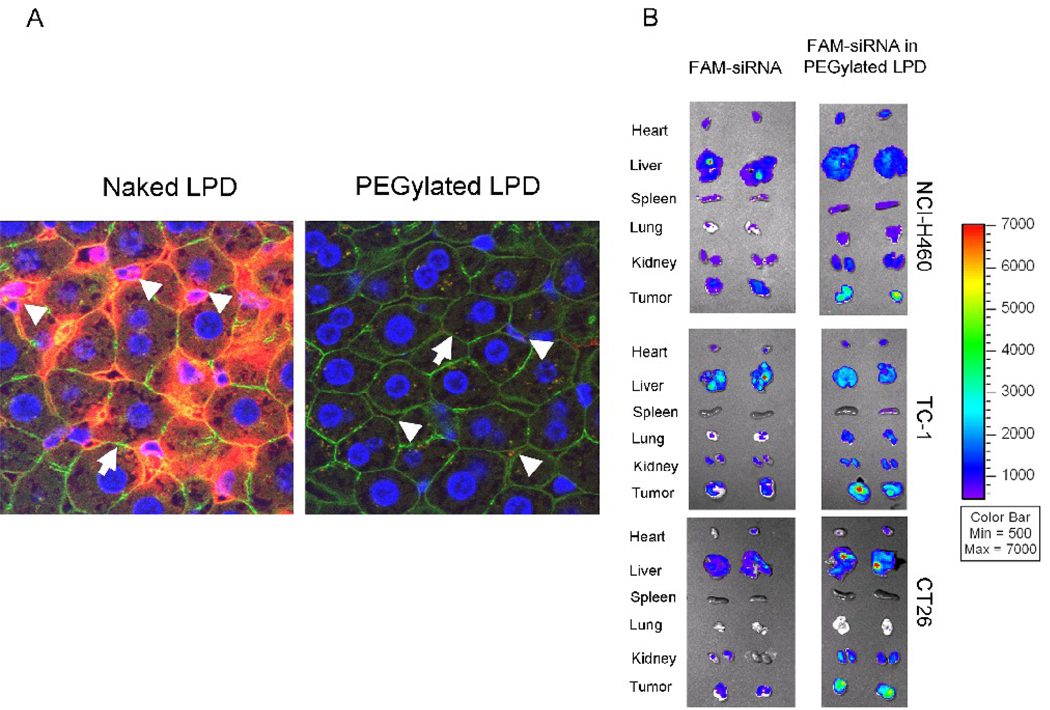
Figure 5.
Tissue distribution analysis. (A) Liver sinusoidal uptake of cy3-siRNA in naked LPD (positive control) and PEGylated LPD. Nuclei (blue), F-actin (green), cy3-siRNA (red). Magnification = 1,600 x. Data are representative pictures from 3 mice in each group. (B) Fluorescence signal of FAM-labeled siRNA in different tissues detected by the Xenogen IVIS imaging system. Data are from two representative animals in each group. Data of the NCI-H460 model are reproduced from a previously published article with permission [7].

