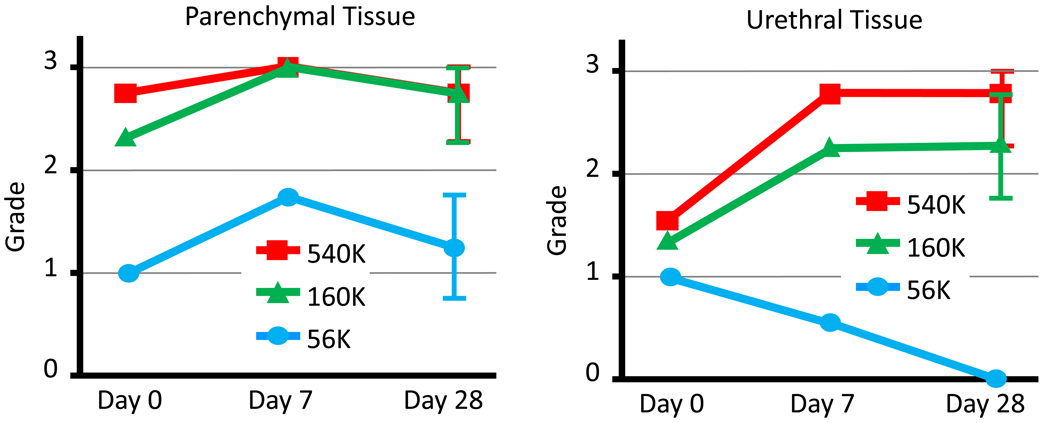
Figure 4.
Summary of average lesion grades (tissue response) for various doses and various harvest times. Error bars represent one standard deviation. Grades of 2 – 3 were considered to represent clinically significant tissue effect. The 56k dose produced significantly lower grades of tissue response than 160k or 540k for both parenchymal and urethral tissue. Urethral tissue exhibited a pronounced difference in tissue response based on dose at harvest times of 7 or 28 days.

