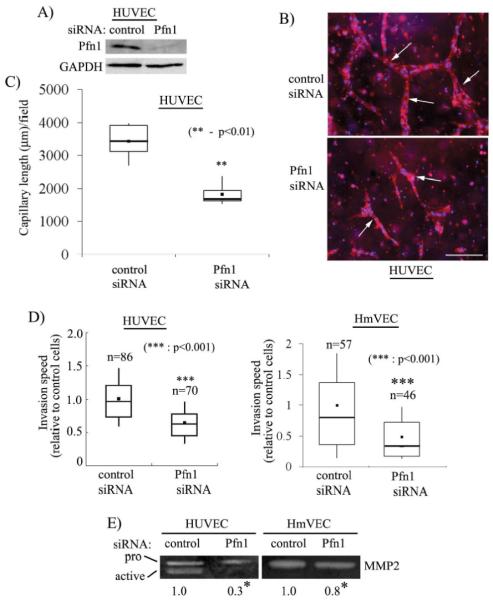
Figure 5. Silencing Pfn1 expression inhibits ECM invasion, MMP2 secretion and 3D capillary morphogenesis.
(A) Pfn1-immunoblot of HUVEC extracts prepared 96 hours after siRNA transfection with GAPDH blot serving as the loading control. (B) Capillary formation (arrows) by control and Pfn1-siRNA treated HUVEC within collagen matrix (blue: DAPI, red: rhodamine-phalloidin) (scale bar - 200 μm) (C) A box and whisker plot comparing the mean values of total capillary length per 10X field of observation between the two transfection conditions (n=2 experiments). (D) A box and whisker plot showing the relative invasion speed of control and Pfn1-siRNA treated HUVEC and HmVEC through collagen (‘n’ indicates the number of cells analyzed for each cell type pooled from 2 independent experiments). (E) Gelatin zymogram of conditioned media from HUVEC and HmVEC showing relative levels of MMP2 between control and Pfn1-siRNA treated conditions (the numbers indicate the relative levels of MMP2 between the two transfection conditions summarized from 2 and 4 independent experiments for HUVEC and HmVEC, respectively; * indicates statistical significance with p<0.01).

