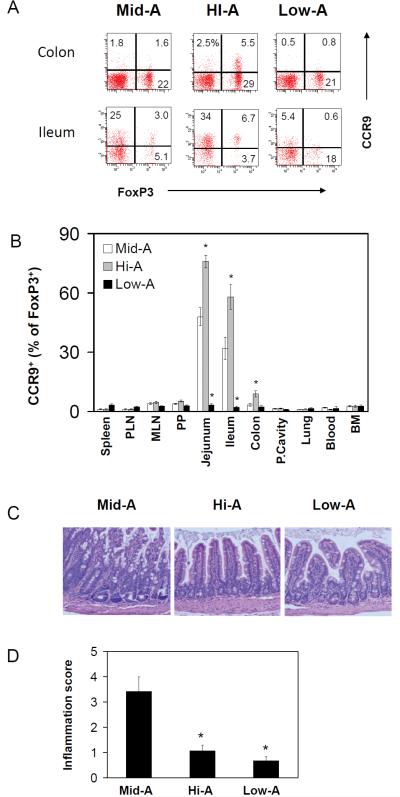
Figure 2. Effects of Low-A and Hi-A statuses on ileitis of SAMP1/YP mice.
Frequencies of CCR9+FoxP3+ T cells in the intestine (A) and eleven tissue sites (B) of Mid-A, Hi-A and Low-A SAMP1/YP mice are shown. The cells shown in panel A is gated on CD4+ T cells. Hematoxylin and eosin staining (C) and inflammation scores for the ileum (D) are shown. SAMP1/YP mice were fed with Low-A, Mid-A or Hi-A diet for 20 weeks for this study. Averages of five mice with SEM are shown. *Significant differences from Mid-A (p<0.05).

