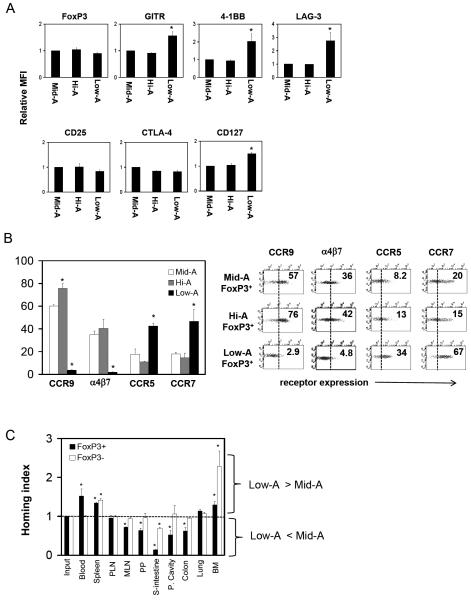
Figure 4. Surface and homing phenotypes of Low-A and Hi-A FoxP3+ T cells.
(A) Expression levels of Treg-associated surface antigens in relative mean fluorescence intensity (MFI). CD4+ CD103+FoxP3+ T cells are gated. (B) Expression of trafficking receptors. (C) Relative homing capacity of Low-A FoxP3+ T cells in vivo. A 20 h homing study was performed in AKR/J mice. A set of combined data of three (A) and four (B and C) experiments or a set of representative data out of four independent experiments (B; dot plots) are shown. *Significant differences from the Mid-A group (A and B) or from the frequencies in the input (C).

