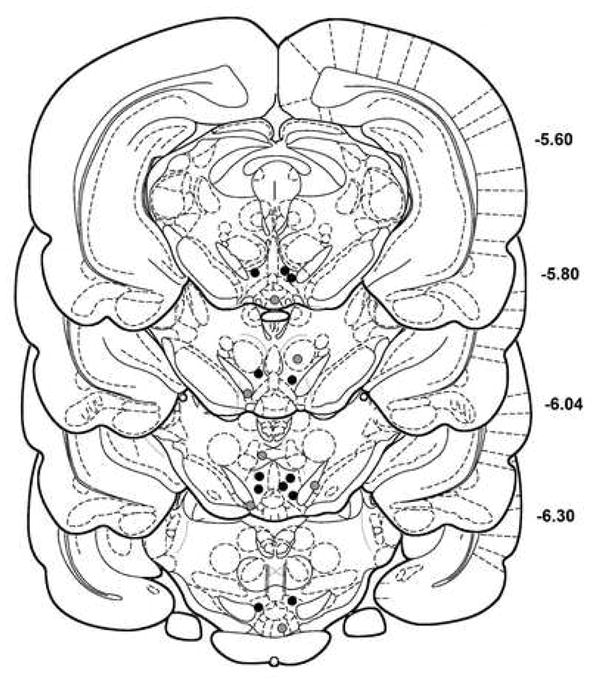
Figure 3.

Histological reconstruction of sites that received unilateral injections of 4μg carbachol. Black circles indicate injection sites within the ventral tegmental area (VTA) that were effective in elevating response thresholds. Gray circles indicate injection sites dorsal, ventral or medial to VTA that produced no change in response thresholds. Coordinates are in millimeters posterior to bregma. Plates are derived from the rat brain atlas of Paxinos and Watson56. The right side of the midline was targeted for all injections, but for the sake of clarity of presentation injection sites are plotted on both sides of the midline.
