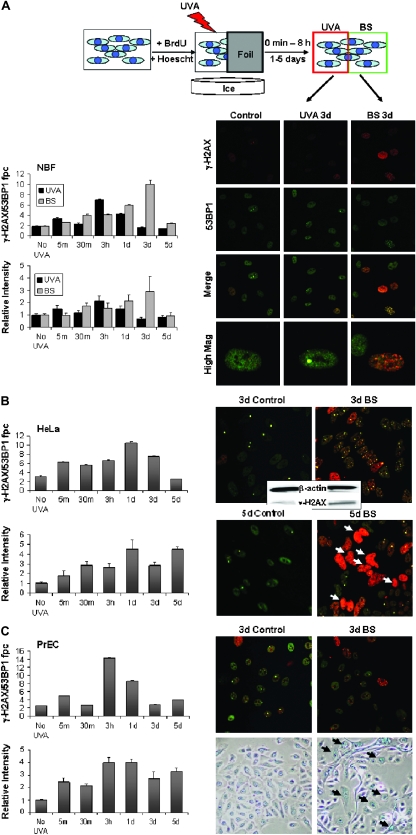
Fig. 1.
Exposure of sensitized cells to UVA light induces bystander responses in shielded cells. (A) Schematic: cell cultures containing BrdU and Hoechst 3342 were irradiated with 0.04 J/cm2 UVA with half the culture shielded with foil. After incubation for various periods, foci containing γ-H2AX and 53BP1 were counted in directly exposed and shielded bystander (BS) cells. Total γ-H2AX intensity was also measured. Shown are representative images of NBF cultures taken 3 days after sham exposure (control, left column), direct exposure (UVA 3d, middle column) or shielded from exposure (BS 3d, right column). Cells were stained for γ-H2AX (red, top row) and 53BP1 (green, second row). Merged images (bottom rows) reveal foci double positive for the two proteins. The graphs show values of colocalized γ-H2AX/53BP1 foci (top left) or total nuclear γ-H2AX intensity (bottom left) per cell for directly irradiated (black bars) and bystander (gray bars) cells at various times post-exposure. Increases in γ-H2AX foci numbers and intensity were statistically significant at 3 h and 1 day in directly exposed cells and from 30 min to 3 days in bystander populations. (B) UVA protocol with HeLa cell cultures. Representative images (see panel A) of HeLa control (sham exposed) and bystander cultures taken 3 and 5 days after exposure. Apoptotic nuclei are indicated by white arrows. Immunoblot analysis of control and bystander HeLa cultures 3 days after exposure is shown in the middle inset. The graphs show values of colocalized γ-H2AX/53BP1 foci (top left) or total nuclear γ-H2AX intensity (bottom left) per cell for bystander (gray bars) cells at various times post-exposure. Results were statistically significant for all time points with the exception of 5 days post-exposure in the top left graph. (C) UVA protocol with PrEC cultures. Representative images of PrEC control and bystander cultures taken 3 days post-exposure stained for γ-H2AX and 53BP1 (top) or senescence-associated beta-galactosidase, a marker of cellular senescence (bottom). The graphs show values of colocalized γ-H2AX/53BP1 foci (top left) or total nuclear γ-H2AX intensity (bottom left) per cell for bystander (gray bars) cells at various times post-exposure. Results were statistically significant at all time points in intensity measurements and at the 5 min, 3 h, 1 day and 5 day time points in focal counting. Error bars in all graphs indicate the SEM for at least 100 cells.

