Abstract
Might DNA sequence variation reflect germline genetic activity and underlying chromatin structure? Using two strains of medaka (Japanese killifish, Oryzias latipes), we compared genomic sequence and mapped ~37.3 million nucleosome cores from medaka Hd-rR blastulae, together with 11,654 representative transcription start sites from six embryonic stages. We observed a ~200-bp periodic pattern of genetic variation downstream of transcription start sites; the rate of insertions and deletions longer than 1bp peaked at positions approximately +200, +400, and +600bp, while the point mutation rate showed corresponding valleys. This ~200-bp periodicity was correlated with the chromatin structure, with nucleosome occupancy minimized at positions 0, +200, +400, and +600bp. These data exemplify the potential for genetic activity (transcription) and chromatin structure to contribute in molding the DNA sequence on an evolutionary timescale.
Mutation and repair characteristics of DNA sequence in experimental systems have been shown in a number of cases to reflect structures in chromatin. For one well-studied experimental system, UV-treated yeast (S. cerevisiae), repair rates for a set of DNA nucleosome core regions are lower than in the surrounding linker regions (1–4). Correlations between chromatin structure and mutation rates have also been suggested in analysis of human and yeast genomes (5–7) . The draft genome sequences of two inbred medaka strains, Hd-rR and HNI (8), provide a remarkable opportunity for extensive comparison between genomic variation and structural features in the genome. The two strains are cross-fertile, yet their genomes are substantially different (approximately 3.42% single nucleotide polymorphism [SNP]) (8). For analysis of chromatin and transcriptional effects on genetic variation, tissue samples including totipotent (germline tissue) would be most relevant, as mutational events in the germline would uniquely contribute to shaping the genome over evolutionary time (9–11).
To characterize transcriptional activity patterns from the medaka genome at embryonic stages, we collected 25-nt 5’-end mRNA tags for 1-, 2-, 3-, 5-, 10-, and 14-day Hd-rR medaka embryos (12). Among a total of ~38.5 million 5’-end tags collected, ~26.2 million (68.14%) were successfully aligned to unique positions in the medaka genome (Fig. S1). Starting with a rough assumption that one cell contains approximately 300,000 mRNA molecules (13), single-copy-per-cell RNAs would be represented by approximately 100 of the ~26.2 million tags. To define a set of active transcription start sites (TSSs), we used a clustering algorithm yielding 11,654 ≥100-tag clusters. >98.4% of neighboring clusters were separated by >100bp from their nearest neighbor (Fig. S3B). A reference TSS for each cluster was defined as the position with the most 5’ end tags.
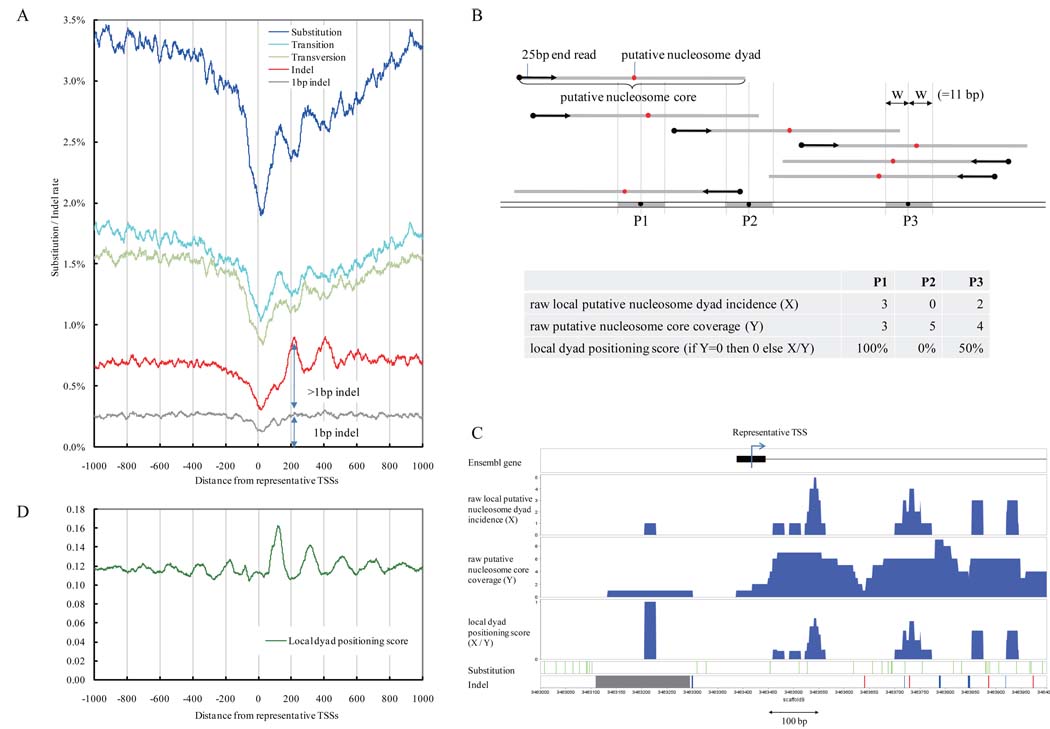
The substitution and indel rates within 1,000bp of the reference TSSs in the 11,654 TSS clusters tend to reach a valley at the TSSs (Fig. 1A), suggesting relative selective constraint within promoters. This is consistent with reports of high conservation around TSS regions in mammals (14). Our analysis in medaka uncovers an additional pattern: the substitution rate (blue line) showed peaks at +100 and +300bp and valleys at +200 and +400bp around the TSSs (the same pattern was also seen in the transition and transversion rates). The indel rate (red line, Fig. 1A) was minimal at the TSSs and maximal at +200bp, while the rate also had peaks at +400 and +600bp. These peaks define regions where indel mutation rates were significantly greater than the average rate (0.59%) for the entire genome, with the signal weakening with increasing distance from TSSs. The indel dataset was then split into a “1bp” category (37.46%) and the remaining ">1bp" category of indels (Fig. S4C). The peaks at +200, +400, and +600bp are generated by the increase in the >1bp category, while the 1bp indel rate does not yield an evident periodicity (Fig. 1A). Comparisons of genetic variation to TSSs were possible in human/chimpanzee or mouse/rat, although not limited to germline or embryo TSSs (Fig. S5). A limited periodicity in substitution rates may be present for these genomes, albeit much smaller in magnitude than that observed with the early transcriptome TSS data from Medaka.
Figure 1.
Diversity rates and nucleosome positions around TSSs. A. The x-axis shows the distance from the representative TSSs in the medaka (Hd-rR) genome. Blue line: mismatch mutation rate; light blue line: transition rate; light green line: transversion rate; red line: indel mutation rate; gray line: rate of indels of length 1bp. For smoothing of lines, a running average over a 23-bp window (one full turn of the helix in each direction) is depicted. B. The upper portion illustrates putative nucleosome dyads (red points, 73bp from start of sequence read) and cores (grey bars; 147bp). The lower table illustrates the distinct meanings of the three nucleosome indicators. C. Distribution of nucleosomes, substitutions, and indels surrounding a TSS. Black boxes: exons of the gene; blue histograms: distributions of the three nucleosome indicators; green vertical bars: substitutions between the Hd-rR and HNI genomes; red bars: deletions from the Hd-rR genome; blue bars: insertions into the Hd-rR genome; gray bars and boxes: failure of alignment. D. The green line presents the average local dyad positioning score.
The ~200-bp periodicity of the substitution and indel rates in Medaka suggested the involvement of nucleosome structure. We isolated mono-nucleosome core DNAs from micrococcal nuclease (MNase) digested chromatin from blastulae (0.5-day embryos that maintain germline character in some (or all) cells, 15) (16, 17) and sequenced 67 million DNA ends to 36bp (12). The first 25bp were sufficient (Fig. S6) to map 37.3 million ends (55.7% of sequenced reads) to unique locations in the medaka genome.
The distribution of distances between nucleosome start and end reads (Fig. S7B) presents a significant peak at ~147bp, coincident with the size of nucleosome cores and indicative of some degree of constraint in nucleosome positioning. To assess nucleosome spacing intervals, we analyzed the distribution of distances between start positions of mapped nucleosome ends (Fig. S7A, 16, 17). We observed a small peak at 165bp, indicating that adjacent nucleosomes in regions with conserved positioning are likely to be located at approximately ~165bp intervals (~18bp linker), while a ~200bp spacing (~50bp linker) was seen downstream of TSSs (see below)..
Our metric for nucleosome position at individual sites in the genome (Fig. 1B) counts the number of putative nucleosome dyads in a 23bp “sliding window” and divides this by the total number of nucleosomes impinging on this window to obtain a localized dyad positioning score (Fig. 1B). The 23bp window (+/− 1 helical turn) is used to accommodate observed variability in nuclease cleavage around nucleosome termini (see Fig. S7B & S8B, 12, 17).
The distribution of nucleosome dyad indicators, substitutions, and indels around several TSS sites is shown in Fig. 1C and Fig. S8. For global analysis, positioning scores (X/Y) were taken into account only in areas covered by multiple nucleosome reads (87.1% of genomic positions (Fig. S9B); the remaining 12.9% correspond in part to repetitive sequences that occupy 17.5% of the medaka genome (8)). In unique regions supported with multiple nucleosome core coverage, putative nucleosome dyads that occur reproducibly in a defined neighborhood allow us to define positioned nucleosomes (Fig. S9C). The average local dyad positioning score has local minima at positions +200, +400, +600, and +800bp from the TSSs (Fig. 1D, green line), suggesting the presence of phased arrays of nucleosomes every ~200bp downstream of the TSS (9–11, 18–21).
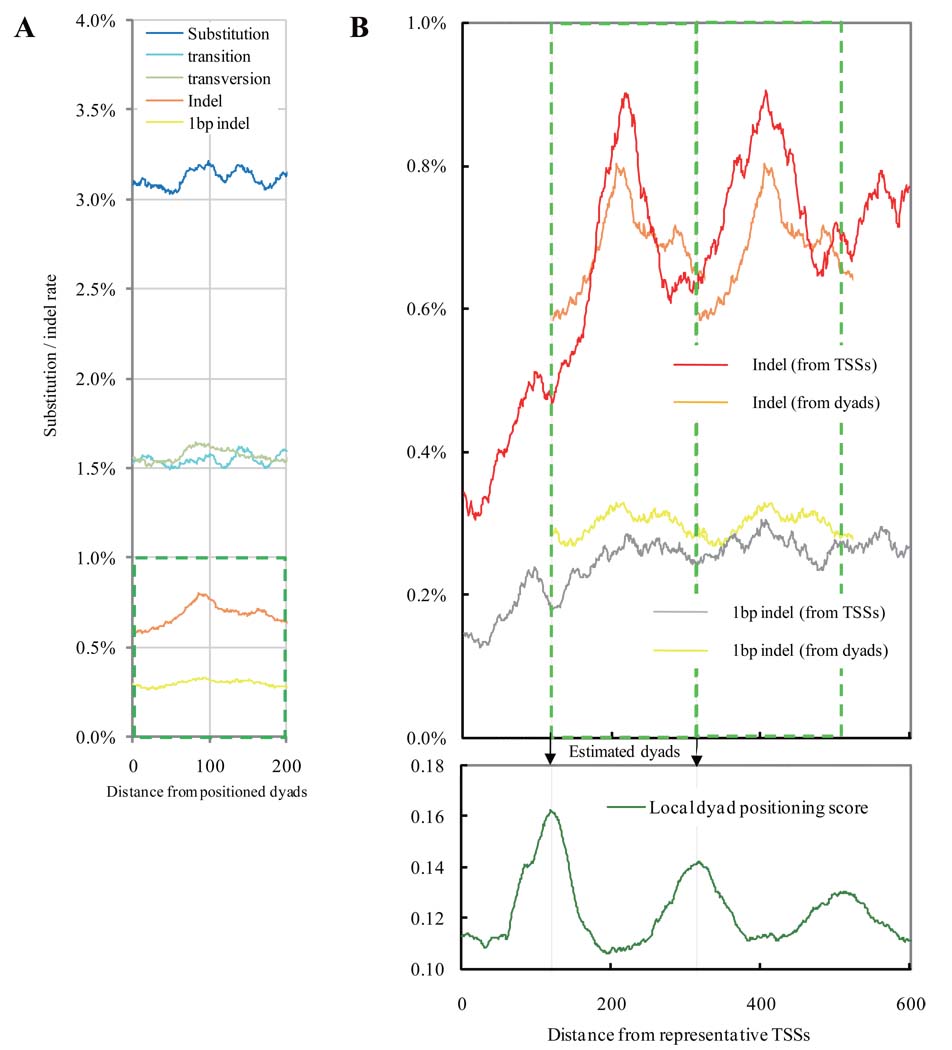
By contrast to the decreased substitution rate in nucleosome linker regions, the indel rate for Medaka had peaks at positions +200, +400, and +600bp from the TSSs, implying that indels of length >1bp are more likely to occur at DNA linker regions. One possible explanation is that DNA linker regions have more indel mutations than the rest of the genome; this idea is supported by the higher indel rate on a genome-wide scale (not limited to TSS regions) in the DNA linkers in regions occupied by positioned nucleosomes (Fig. 2). One may wonder if the substitution rate increases towards the positioned dyads in non-promoter regions; however, this tendency was not observed (Fig. 2A). These observations suggest an interplay of transcription and nucleosome positioning in determining susceptibility to substitutions and indel mutations.
Figure 2.
Mutational spectra at positions around 8,181 positioned dyads that are isolated from their neighboring dyads by >165bp and are covered by an average of 5.44 putative nucleosome cores on a genome-wide scale (excluding TSSs and coding regions). A. In non-promoter regions where transcription does not occur, the two locations in the distinct strands are positionally equivalent in a nucleosome core if they are the same distance from the dyad. The x-axis presents the distance. Blue line: substitution rate; light blue line: transition rate; light green line: transversion rate; orange line: indel rate; yellow line: rate of 1bp indels. B. An expanded view of the indel rates enclosed in the green square in Fig. 2A is duplicated in tandem, and the two copies are overlaid for comparison with equivalent measurements relative to TSSs in Fig. 1A.The bottom panel presents the estimated dyads (arrows) aligned with dyad positioning score near TSSs (expanded from Fig. 1D).
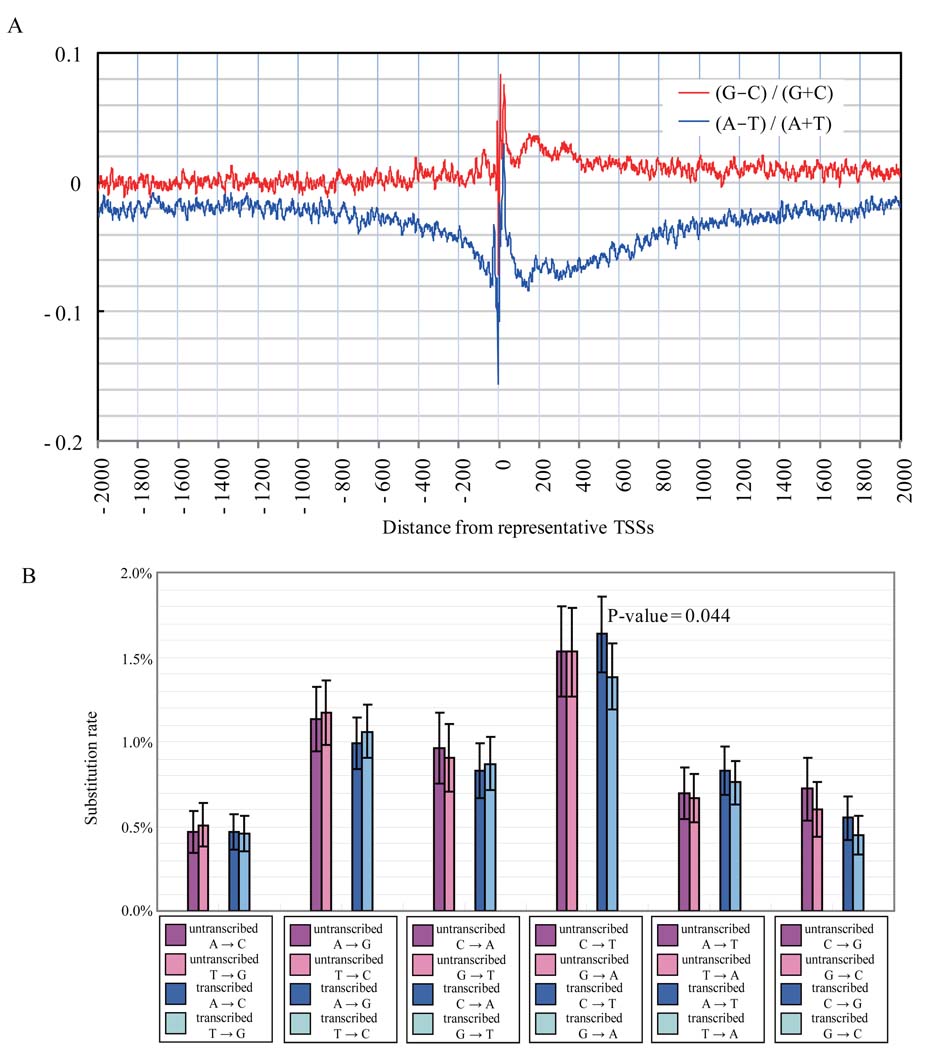
Transcription-coupled DNA repair (TCR), a mechanism that protects transcribed regions from mutations, might contribute to the observed sequence effects (2, 22–24). TCR is thought to work simultaneously with mRNA transcription involving RNA polymerases I and II; resulting in an asymmetric effect with an overabundance of G+T over A+C downstream from the TSSs (through an excess of C-to-T mutations over G-to-A mutations, (22, 23). A significant asymmetry of the base composition is found in examining natural variation in the medaka genome at TSSs (Fig. 3A). Examining reciprocity in frequencies of the 12 possible base substitutions in 319 transcribed loci (121.1Kbp, in total; regions where ancestry could be inferred by comparison to sequence data from an outgroup species), only the C-to-T versus G-to-A in the transcribed regions downstream of TSSs showed a significant strand bias (Fig. 3B; p-value=0.044, 12). This is consistent with TCR as one of the factors contributing to the character of natural sequence variation in these regions.
Figure 3.
A. Base composition surrounding transcription start sites (TSSs). Red line: the difference between guanines and cytosines; blue line: the difference between adenines and thymines. B. Substitution ratio around TSSs. Rates for each substitution and its complement and their 95% confidence intervals are indicated side by side for untranscribed and transcribed regions that are upstream and downstream of TSSs, respectively.
Several possible causal and structural relationships might link sequence composition to mutagenesis rates and nucleosome positioning around transcriptional start sites. One rather simple explanation for the remarkable periodicity in mutation rates might have been an underlying bias in sequence composition in nucleosome core regions that favored certain types of mutations, while distinct sequence composition in linkers would favor other types of mutations. We addressed this possibility by examining sequence composition in general and around sites of genetic variation as a function of positioning relative to nucleosomes and TSSs (Fig. S13, 12). This analysis gave no indication that differential mutagenesis could be accounted for by an initial sequence bias. A second intriguing possibility is that mutagenesis rates are influenced toward periodicity not by the structural constraints of the chromatin template but by functional constraints related to overall organismal fitness. Thus, for example, it would be conceivable that substitutions might be underrepresented in a critical set of linker sequences that are essential in maintaining specific transcription complexes and nucleosome-based structures downstream of TSSs. We do not favor this explanation for the Medaka data, since indel mutations show an opposite distribution, occurring more frequently in the linker regions. Instead, the biases in genetic variation seem most likely to represent structural constraints of the chromatin template during the mutagenic processes that Medaka has encountered during evolutionary time. The mechanistic points at which nucleosomes may have influenced mutagenesis/repair processes in medaka evolution are (by definition) not known. The ability of nucleosomes in model assay systems to block repair of certain DNA lesions (e.g., ref. 3) certainly provides a precedent for the observed higher substitution rates in core regions. The complementary pattern of indels in Medaka could reflect any of several conceivable linker/core differences (e.g., higher susceptibility of cores to breakage or less precise break repair in linkers).
For any species, the balance of specific mutagenic and repair processes occurring over history would have shaped the genome in potentially unique ways; thus not all genomes would be expected to show a qualitatively or quantitatively equivalent "shadow" of germline chromatin structure. Our working model for the basis of structural variation between the genomes of these two inbred medaka strains is that chromatin structure influences mutagenesis, which in turn influences genetic variation to provide the observed periodic pattern near the 5' ends of germline-transcribed genomic segments. We expect the influence of chromatin structure to be a general feature of sequence evolution throughout the genome and the biosphere.
Supplementary Material
Footnotes
One-sentence summary:
Sequence variation in the DNA Japanese killifish, Oryzias latipes, shows a periodic pattern downstream of transcription start sites that is strongly correlated with chromatin structure.
References and Notes
- 1.Tijsterman M, de Pril R, Tasseron-de Jong J, Brouwer J. Mol Cell Biol. 1999;19:934. doi: 10.1128/mcb.19.1.934. [DOI] [PMC free article] [PubMed] [Google Scholar]
- 2.Svejstrup J. Nat. Rev. Mol. Cell Biol. 2002;3:21. doi: 10.1038/nrm703. [DOI] [PubMed] [Google Scholar]
- 3.Wellinger R, Thoma F. Embo J. 1997;16:5046. doi: 10.1093/emboj/16.16.5046. [DOI] [PMC free article] [PubMed] [Google Scholar]
- 4.Suter B, Livingstone-Zatchej M, Thoma F. Embo J. 1997;16:2150. doi: 10.1093/emboj/16.8.2150. [DOI] [PMC free article] [PubMed] [Google Scholar]
- 5.Higasa K, Hayashi K. BMC Genomics. 2006;7:66. doi: 10.1186/1471-2164-7-66. [DOI] [PMC free article] [PubMed] [Google Scholar]
- 6.Prendergast J, et al. BMC Evol Biol. 2007;7:72. doi: 10.1186/1471-2148-7-72. [DOI] [PMC free article] [PubMed] [Google Scholar]
- 7.Washietl S, Machne R, Goldman N. Trends Genet. 2008 Oct 23; doi: 10.1016/j.tig.2008.09.003. [DOI] [PubMed] [Google Scholar]
- 8.Kasahara M, et al. Nature. 2007;447:714. doi: 10.1038/nature05846. [DOI] [PubMed] [Google Scholar]
- 9.Ozsolak F, Song J, Liu X, Fisher D. Nat Biotechnol. 2007;25:244. doi: 10.1038/nbt1279. [DOI] [PubMed] [Google Scholar]
- 10.Whitehouse I, Rando O, Delrow J, Tsukiyama T. Nature. 2007;450:1031. doi: 10.1038/nature06391. [DOI] [PubMed] [Google Scholar]
- 11.Schones D, et al. Cell. 2008;132:887. doi: 10.1016/j.cell.2008.02.022. [DOI] [PMC free article] [PubMed] [Google Scholar]
- 12.Materials and methods are available as supporting material on Science Online.
- 13.Velculescu V, et al. Nat Genet. 1999;23:387. doi: 10.1038/70487. [DOI] [PubMed] [Google Scholar]
- 14.Taylor M, et al. PLoS Genet. 2006;2:e30. doi: 10.1371/journal.pgen.0020030. [DOI] [PMC free article] [PubMed] [Google Scholar]
- 15.Hong Y, Winkler C, Schartl M. Proc Natl Acad Sci U S A. 1998;95:3679. doi: 10.1073/pnas.95.7.3679. [DOI] [PMC free article] [PubMed] [Google Scholar]
- 16.Johnson S, Tan F, McCullough H, Riordan D, Fire A. Genome Res. 2006;16:1505. doi: 10.1101/gr.5560806. [DOI] [PMC free article] [PubMed] [Google Scholar]
- 17.Valouev A, et al. Genome Res. 2008 [Google Scholar]
- 18.Ioshikhes I, Albert I, Zanton S, Pugh B. Nat Genet. 2006;38:1210. doi: 10.1038/ng1878. [DOI] [PubMed] [Google Scholar]
- 19.Albert I, et al. Nature. 2007;446:572. doi: 10.1038/nature05632. [DOI] [PubMed] [Google Scholar]
- 20.Lee W, et al. Nat Genet. 2007;39:1235. doi: 10.1038/ng2117. [DOI] [PubMed] [Google Scholar]
- 21.Mavrich T, et al. Nature. 2008;453:358. doi: 10.1038/nature06929. [DOI] [PMC free article] [PubMed] [Google Scholar]
- 22.Francino M, Chao L, Riley M, Ochman H. Science. 1996;272:107. doi: 10.1126/science.272.5258.107. [DOI] [PubMed] [Google Scholar]
- 23.Green P, Ewing B, Miller W, Thomas P, Green E. Nat Genet. 2003;33:514. doi: 10.1038/ng1103. [DOI] [PubMed] [Google Scholar]
- 24.Polak P, Arndt P. Genome Res. 2008;18:1216. doi: 10.1101/gr.076570.108. [DOI] [PMC free article] [PubMed] [Google Scholar]
- 25.This work was supported in part by a Grant-in-Aid for Scientific Research on Priority Areas (C) from the MEXT, by the JST and by the NIH (T32 CA09151 to CCM; R01GM37706 to AF). Computational time was provided by the Human Genome Center and the Information Technology Center, the University of Tokyo. We thank A. Sidow, A. Valouev, S. Johnson, J. Ford, and J. Cai for specific advice over the course of this work and our colleagues at each institution for their help and suggestions. All sequence data are deposited at NCBI Short Read Archive (accession number SRA002449).
Associated Data
This section collects any data citations, data availability statements, or supplementary materials included in this article.


