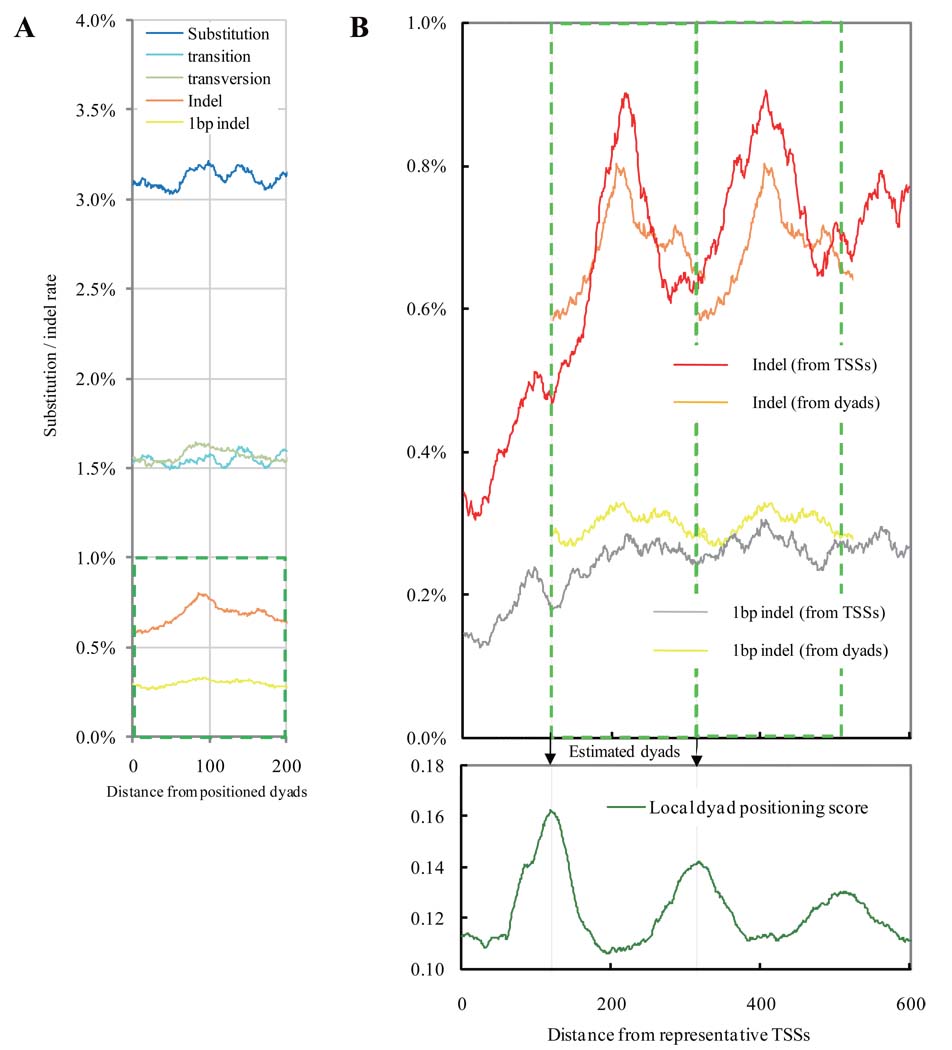
Figure 2.
Mutational spectra at positions around 8,181 positioned dyads that are isolated from their neighboring dyads by >165bp and are covered by an average of 5.44 putative nucleosome cores on a genome-wide scale (excluding TSSs and coding regions). A. In non-promoter regions where transcription does not occur, the two locations in the distinct strands are positionally equivalent in a nucleosome core if they are the same distance from the dyad. The x-axis presents the distance. Blue line: substitution rate; light blue line: transition rate; light green line: transversion rate; orange line: indel rate; yellow line: rate of 1bp indels. B. An expanded view of the indel rates enclosed in the green square in Fig. 2A is duplicated in tandem, and the two copies are overlaid for comparison with equivalent measurements relative to TSSs in Fig. 1A.The bottom panel presents the estimated dyads (arrows) aligned with dyad positioning score near TSSs (expanded from Fig. 1D).

