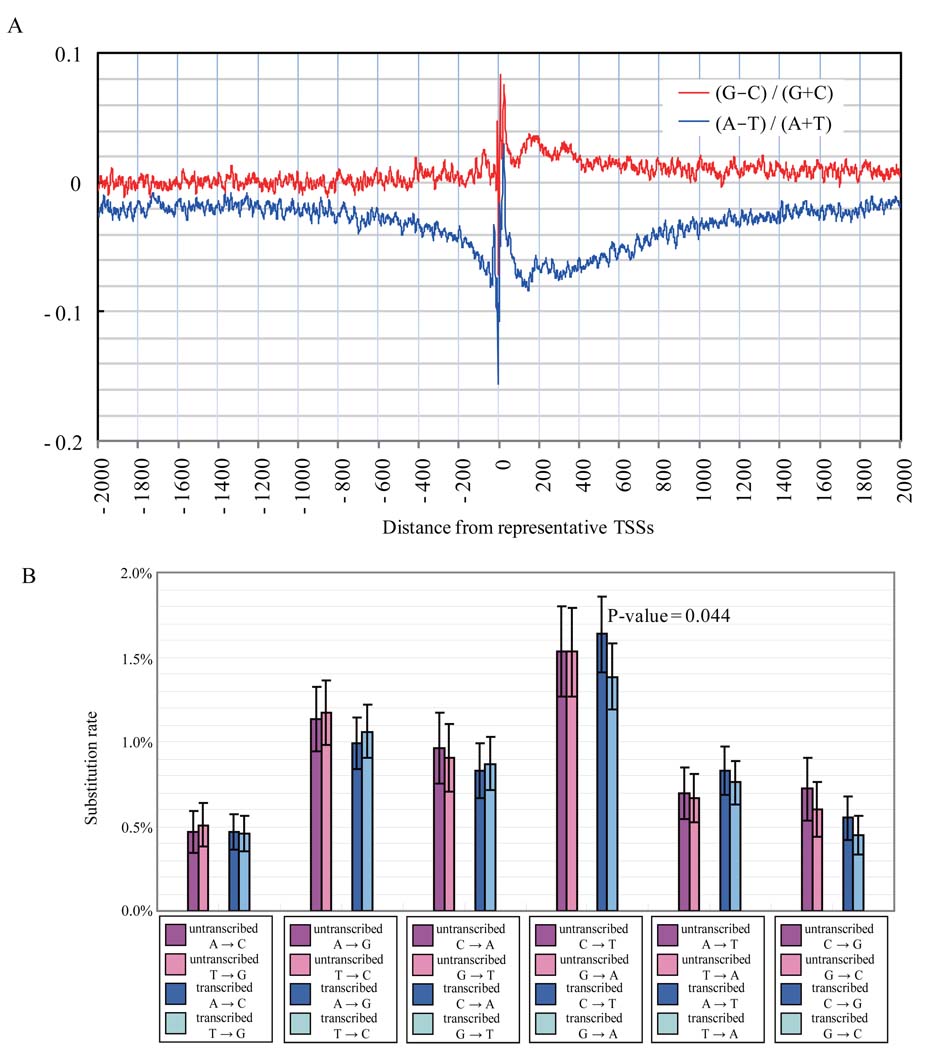
Figure 3.
A. Base composition surrounding transcription start sites (TSSs). Red line: the difference between guanines and cytosines; blue line: the difference between adenines and thymines. B. Substitution ratio around TSSs. Rates for each substitution and its complement and their 95% confidence intervals are indicated side by side for untranscribed and transcribed regions that are upstream and downstream of TSSs, respectively.

