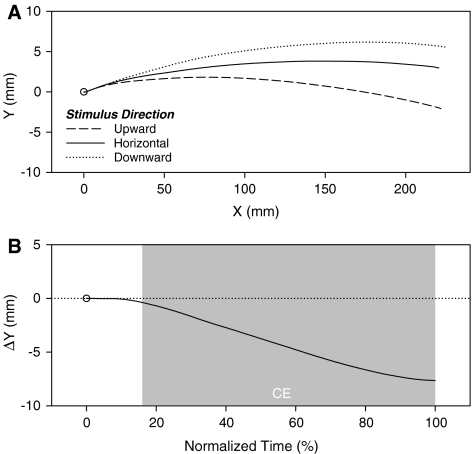
Fig. 2.
Data from the second subtrial movements in “Experiment 1”. a Mean horizontal movement trajectories as a function of the concurrently perceived stimulus direction (upward, horizontal, downward). b Mean difference in y position (ΔY) between horizontal movement trajectories produced under upward and downward stimulus direction conditions as a function of normalized time. Positive and negative ΔY values correspond to assimilation and contrast, respectively. The shaded region indicates the normalized time values at which ΔYs are significantly different from 0, that is the values at which an assimilation (AE) or contrast effect (CE) was present

