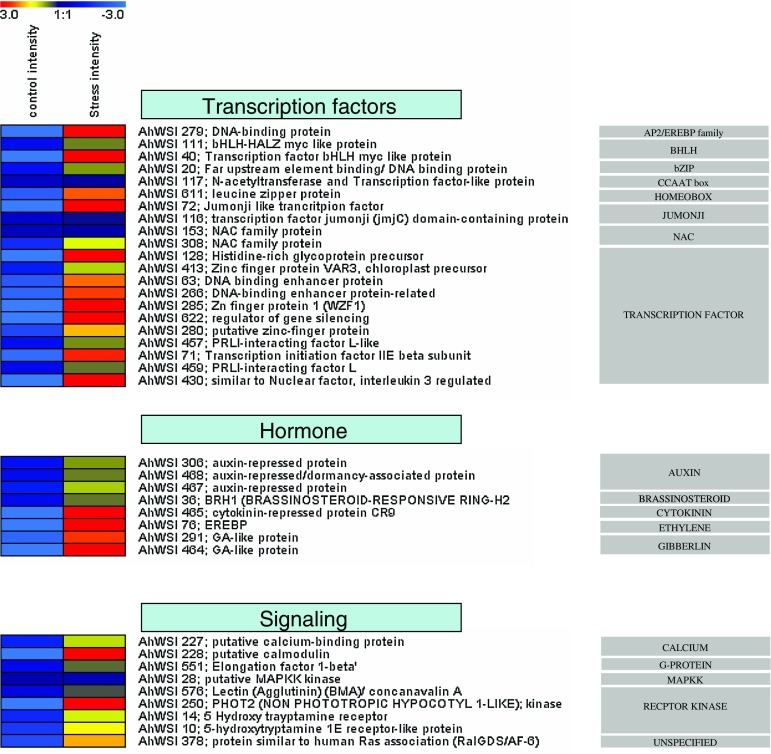
Fig. 4.
Expression profiles of selected regulatory genes induced under drought stress from dot blot experiments were shown as heat maps. Expression values are given in logarithmically scaled (base 2) signal intensities: red high expression, yellow moderate expression, blue low expression. Clone identity, putative BLAST description and defined functional classes are provided on the right side of figure

